Volcanoes are among the most iconic of Earth’s structures, active portals conveying the Hadean depths to the heavens, and all the ecosystems in between. When the topic of volcanoes comes up, most people think of Kilauea’s lavas flows, Eyjafjallajökull’s ash cloud grounding air traffic, or lovers caught in a last embrace at Pompeii. Volcanoes turn out to also be an important forcing of Earth’s climate, and not just because they spew greenhouse gases (at this point, they release carbon dioxide 100 times slower that our civilization). The most recent, climatically significant eruption was that of Mount Pinatubo in 1991, immortalized in this picture.

Read more: https://globalnation.inquirer.net/100047/filipinos-pinatubo-photo-named-among-greatest-of-all-time#ixzz6GzFFGzsK
Terrifying though that moving mountain of ash and burning gas may be, it does not, in fact, have much effect on climate: that ash is short-lived and shallow, easily scavenged out of the lower atmosphere by rain. What does matter for climate are the sulfur emissions (specifically, SO2), which coagulate into fine droplets that are rather effective at reflecting sunlight. Explosive eruptions produce buoyant plumes that can catapult such reflectors into the stratosphere (the region of the atmosphere just over the cruising altitude of commercial jetliners), where they are isolated from the stormy turmoil of the troposphere (the lower layer that we breathe). In the stable heights of the stratosphere, volcanic aerosols persist for several years, during which they have ample time to circumnavigate a good chunk of the globe, thanks to the stratosphere’s vigorous circulation. The typical climate impacts begin shortly after an eruption, usually peaking within a year, with a gradual return to “normal” (if there is such a thing for a chaotic system like Earth’s climate) within 5 years.
At least, that’s the picture painted from the painfully short instrumental record, which has seen only a handful of climatically-significant eruptions — Pinatubo and El Chichon (1982) being the only ones that were recorded by satellites. For this reason, the way stratospheric aerosol forcing is implemented in climate models mimics what happened during Pinatubo, because that’s the largest one we have observed with any global coverage.
However, we also have ample geologic and documentary evidence for much larger eruptions prior to that: for instance, the “year without a summer” due to the Tambora eruption of 1816, or the Samalas eruption of 1257, the largest of the Common Era, and probably the third largest of the last 10,000 years, according to ice cores. Yes, what falls out of the stratosphere eventually falls to ice caps, where they can recorded within the annual layers of fast-accumulating ice deposits. (for more on how we reconstruct volcanic forcing from ice cores, see this article). So paleoclimatologists, volcanologists, archeologists, geographers, historians and climate modelers have long been interested in how volcanoes influence climate and society.
Another reason study the climate response to volcanic aerosols: they serve as our best analog for a form of geoengineering called “solar radiation management”, which is — to the immense dismay of reasonable people — now considered as a viable policy proposal to mitigate the worst impacts of climate change (while creating a host of gruesome side effects that such proposals tend to ignore).
All of this to say that volcanoes offer incredible natural experiments with which to probe Earth’s climate system, and how it is represented by climate models (the computer codes used to project climate’s evolution over the next century, for instance). The last assessment report of the Intergovernmental Panel on Climate Change (IPCC), in particular, summarized the peer-reviewed literature as of 2013, and highlighted the conundrum illustrated here:
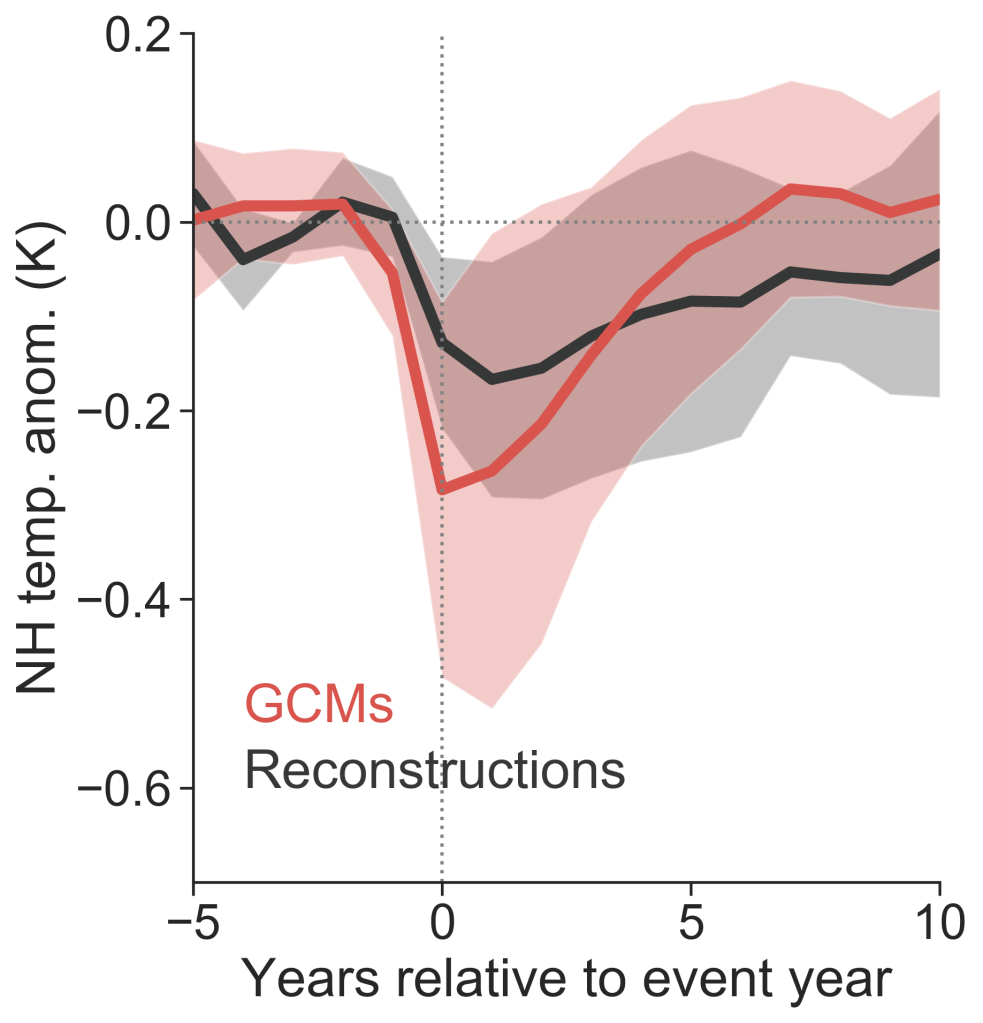
The figure shows that, on average, climate model simulations of northern hemisphere temperature tended to produce a response to volcanic cooling that was stronger, peaked earlier, and recovered more rapidly, than temperature reconstructed from paleoclimate indicators (tree-rings, corals, ice cores, sediment cores, etc). On the face of it, such a discrepancy could call into question the fidelity of climate simulations, the accuracy of paleoclimate reconstructions, the quality of the forcing, and perhaps all three. Like many IPCC figures, it has stimulated many of us to think deeply about what is going on.
In 2017, my group was lucky enough to receive funding from the National Oceanographic and Atmospheric Administration to study this and other climate impacts of volcanic eruptions through the new prism of paleoclimate data assimilation, particularly the Last Millennium Reanalysis. One of the goals of the project is to understand (and hopefully correct) the discrepancy shown above. After some very careful work (and a lot of Python code), USC graduate student Feng Zhu reports in a recent paper (soon to be published in Geophysical Research Letters) that the discrepancies can indeed be reconciled, with a few asterisks.
At the risk of spoiling the suspense, here’s the same picture, after accounting for known effects due to (1) the location of paleoclimate records (mostly, trees); (2) the seasonality of these proxies (extratropical trees only grow during the summer), and (3) focusing on the observations types that are least affected by a process called biological memory (maximum latewood density, or MXD).

This figure shows that, for well-characterized eruptions and a careful, like-to-like comparison of climate models and MXD records, the discrepancy is resolved to a shocking extent. Remarkably, this holds true for two very different sets of paleoclimate observations, a handpicked selection like NTREND, or a more permissive selection like PAGES 2k. For details, the reader is invited to read the paper (in press at Geophysical Research Letters).
Now, before you take this to the bank, there are a few asterisks. The first thing to mention is that we are not the first to point out that these effects matter; indeed our study was motivated by decades of research by many careful scientists. Standing on the shoulders of giants, as always. Our main contribution is to weave all these factors together to enable a systematic comparison of models and reconstructions over multiple eruptions. Yet a big caveat is that the comparison could only be done on 6 eruptions, highlighted in this figure:

While the promise of paleoclimatology is to sample many more and larger events than captured over the instrumental record, we found our sample still limited, for three reasons:
- Forcing uncertainties: many of the model simulations used the Gao et al 2008 forcing, which has now been considerably refined by the incredibly careful work of Michael Sigl and co-authors. As a result, many of the eruptions were just not comparable, or we had to manually adjust the timing of eruptions to really compare like to like. The comparison should be much richer when PMIP4 simulations, which use the evolv2k dataset, come online.
- Data coverage: the “pull of the recent” is as real in paleoclimatology as it is in paleobiology. What this means is that the most recent eruptions are the one that are best captured by our proxy network; the old ones, not so much. This remains a problem for the 1257 (Samalas) and 1450’s (Kuwae + others?) eruptions, as we discuss at length in the paper. We therefore had to focus on the last 4 centuries — not the full Common Era as we were hoping for.
- Cluster effects: some eruptions tend to happen in clusters, making it hard to separate their effects. To keep the comparison clean, Feng chose to focus on isolated eruptions, which further reduces the number of eruptions.
So while our careful analysis of the data enables a spectacular resolution of discrepancies between models and reconstructions, that is only the case for this small set of 6 eruptions. Therefore, our conclusion (that the physics of the climate models is not the main culprit here ; only the way the comparison was previously done) presently applies only to these 6 eruptions. At least, for now: there is obviously a large potential for expanding the set of eruptions for this comparison in PMIP4, and as more MXD chronologies are incorporated in data syntheses like PAGES 2k or N-TREND.
One of the more interesting questions is whether our conclusion would hold true for much larger eruption like Samalas, mentioned earlier. As pointed out before, models and reconstructions disagree fiercely on that one. In 2015, Markus Stofffel and his group did some exciting work showing that you could reduce much of the difference by looking at carefully screened long MXD chronologies, considering seasonality (as we did) and improving how stratospheric sulfur aerosols are represented in models. These “self-limiting” feedbacks have long been known to become important for very high sulfate loading, yet a lot of climate models did not incorporate them. Using the IPSL model with a particular formulation of this feedback, Stoffel et al concluded that the improved stratospheric physics was key to bringing models and reconstructions in line. Does this contradict our result?
We don’t know yet. It remains to be seen how their comparison would work for a broader set of models and observations. The good news is that Feng made all his open-source (Python) code freely available to reproduce and extend the results of the paper. I, for one, would love to have more simulations to play with, incorporating such improved physics and seeing whether the reconstructions can help discriminate between competing parameterizations. If you have ideas for how you’d like to extend this study, please reach out! This type of work lends itself well to long quarantines.


