Sometimes science progresses by overturning old dogmas, covering the minds behind luminaries in glory and celebrating individual genius. More often, however, it proceeds quietly, through the work of many scientists slowly accumulating evidence, much like sedimentary strata gradually deposited upon one another over the immensity of geologic time.
The recent PAGES 2k data compilation, which I had the privilege of helping carry across the finish line, falls squarely in the latter category. To be sure, there is plenty of new science to be done with such an amazingly rich, well-curated, and consistently formatted dataset. Some of it is being done by the 2k collective, and published here. Some of it is carried out in my own research group. Most of it is yet to be imagined. But after slicing and dicing the dataset in quite a few ways, one thing is already quite clear: the Hockey Stick is alive and well.
For those who’ve been sleeping, the Hockey Stick is the famous graph, published in 1999 by Mann, Bradley and Hughes (MBH) and reproduced below. You only need a passing knowledge of climate science to know that it was pretty big news at the time, especially when, in 2001, it was featured in the summary for policy-makers of the Third Assessment Report of the IPCC. The graph was hailed as definitive proof of the human influence on climate by some, and disparaged as a “misguided and illegitimate investigation” by the ever-so-unbiased Joe Barton.
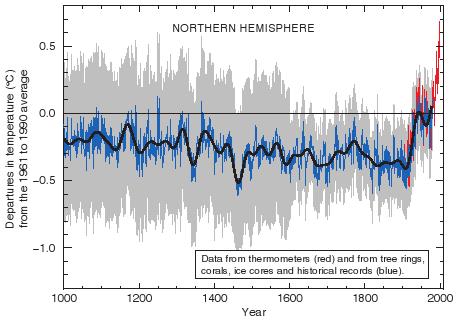
Because of its IPCC prominence, the graph, the science behind it, and especially its lead author (my colleague Michael E. Mann) became a lightning rod in the climate “debate” (I put the word in quotes to underline the fact that while a lot of the members of the public seem to be awfully divided about it, climate scientists aren’t, and very very few argue about the obvious reality that the Earth is warming, principally as a result of the human burning of fossil fuels).
Since 1998/1999, when the Hockey Stick work started to come out, the field has been very busy doing what science always does when a striking result first comes out: figuring out if is robust, and if so, how to explain it. Mike Mann did a lot of that work himself, but science always works best when a lot of independent eyes stare at the same question. Two things were at issue: the statistical methods, and the data, used by MBH.
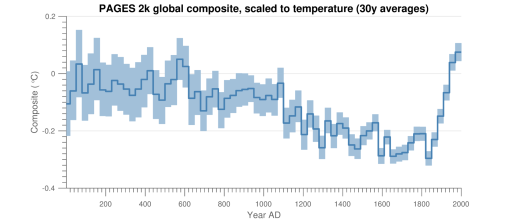
Both matter immensely, and I’ve done my fair share of work on reconstruction methods (e.g. here and here). Yet many in the paleoclimate community felt that a lot more could be done to bolster the datasets that go into reconstructions of past temperature, regardless of the methods, and that they had a unique role to play in that. The PAGES 2k Network was thus initiated in 2006, with the goal of compiling and analyzing a global array of regional climate reconstructions for the last 2000 years. Their first major publication came in 2013, and was recounted here. Its most famous outcome was seen as a vindication of the Hockey Stick, to the point that the wikipedia page on the topic now shows the original “Hockey Stick graph” from MBH99 together with the PAGES2k global “composite” (it cannot be called a reconstruction, because it was not formally calibrated to temperature).
Like many others, I had my issues with the methods, but that was not the point: compared to MBH and subsequent efforts, the main value of this data collection was that it was crowdsourced. Many experts covering all major land areas had collaborated to gather and certify a dataset of temperature-sensitive paleoclimate proxies.
The collective, however, felt that many things could be improved: the regional groups had worked under slightly different assumptions, and produced reconstructions that differed wildly in methodology and quality. The coverage over the ocean was practically non-existent, which is a bit of a problem given that they cover about two thirds of the planet (and growing, thanks to sea-level rise). Finally, the data from the regional groups were archived in disparate formats, owing to the complete (and vexing) lack of data standard in the field. So the group kept moving forward to address these problems. Late in 2014 I got an email from Darrell Kaufman, who asked if I would help synthesizing the latest data collection to produce a successor to the 2013 PAGES 2k curve. Not having any idea what I was getting myself into (or rather, what my co-blogger and dear friend Kevin Anchukaitis had gotten me into), I accepted with the foolish enthusiasm that only ignorance and youth can afford.
I knew it would work out in the end because the data wrangler in chief was Nick McKay, who can do no wrong. What I sorely under-estimated was how long it would take us to the point where we could publish such a dataset, and even more so, how long until a proper set of temperature reconstructions based on this dataset would be published. Much could be said about the cat-herding, the certifications, the revisions, the quality-control, and the references (oh, the references! Just close your eyes and imagine 317 “paper” reference and 477 data citations. Biblatex and the doi.org API saved out lives, but the process still sucked many months out of Nick’s, Darrel’s, and my time – a bit reminiscent of the machine in Princess Bride). Many thanks need to be given to many people, not least to then-graduate student Jianghao Wang, who developed an insane amount of code on short notice.
But that would take away from the main point: I promised you hockey sticks, and hockey sticks you shall get. Back in 2007 Steve McIntyre (of ClimateAudit fame) told me “all this principal component business is misguided; the only way you really get the central limit theorem to work out in your favor is to average all the proxies together. This is variously known as “compositing” or “stacking”, but after raising a toddler I prefer the term “smushing” (those of you who have ever given a soft fruit to a toddler will know just what I mean).
Now, it may not be apparent, but I don’t think much of smushing. On the other hand, the goal of this new PAGES 2k activity was to publish the dataset itself in a data journal, which entailed keeping all interpretations out of the “data descriptor” (the sexy name for such a paper). Many PAGES 2k collaborators wanted to publish proper reconstructions using this dataset, and this descriptor could not go into comparing the relative merits of several statistical methods (a paper led by Raphi Neukom, which we hope to wrap up soon, is set to do just that). Yet a key value proposition of the data descriptor was to synthesize the 692 records we had from 648 locales, seeing if any large-scale signal emerged out of the inevitable noise of climate proxies. So I overcame my reticence and I went on a veritable smushing fest, on par with what a horde of preschoolers would do to a crate of over-ripe peaches.
The result? Peach purée. Hockey sticks! HOCKEY STICKS GALORE!!!
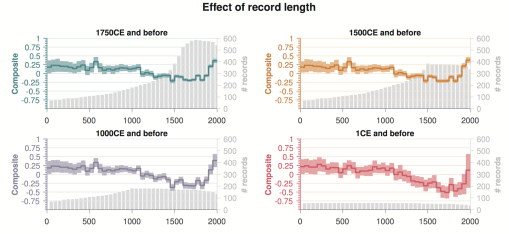
At first I did not think much of it. Sure, you could treat the data naïvely and get a hockey stick, and what did that prove? Nothing. So I started slicing and dicing the data set in all the ways I could think of.
By archive type? Mostly, that made other hockey sticks (except for marine sediments, which end too early, or have too much bioturbation, to show the blade). By start date? Hockey sticks.
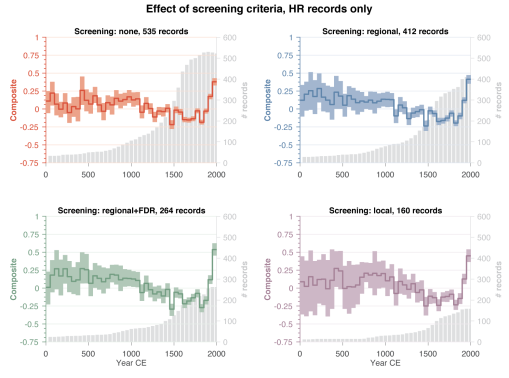
Depending on how to screen the data? Nope, still a bunch of hockey sticks.
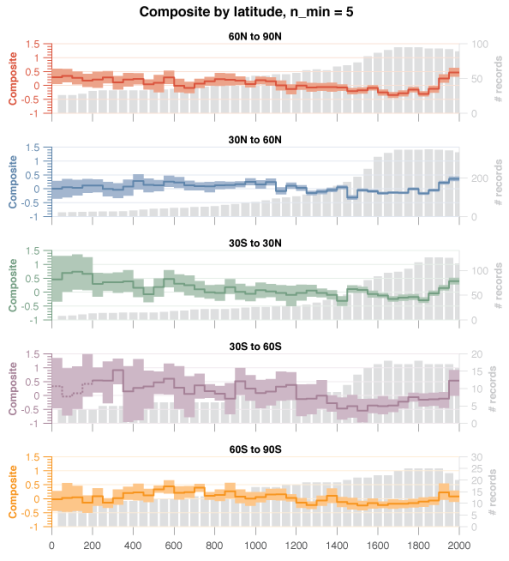
By latitude? Mostly, hockey sticks again, except over Antarctica (look forward to a article by the Ant2k regional group explaining why).
As a scientist, you have to go where the evidence takes you. You can only be smacked in the face by evidence so many times and not see some kind of pattern. (you will never guess: a HOCKEY STICK!).
It’s been nearly 20 years since the landmark hockey stick study. Few things about it were perfect, and I’ve had more than a few friendly disagreements with Mike Mann about it and other research questions. But what this latest PAGES 2k compilation shows, is that you get a hockey stick no matter what you do to the data.
The hockey stick is alive and well. There is now so much data supporting this observation that it will take nothing short of a revolution of how we understand all paleoclimate proxies to overturn this pattern. So let me make this prediction: the hockey stick is here to stay. In the coming years and decades, the scientific community will flesh out many more details about the climate of the past 2,000 years, the interactions between temperature and drought, their regional & local expressions, their physical causes, their impact on human civilizations, and many other fascinating research questions. But one thing won’t change: the twentieth century will stick out like a sore thumb. The present rate of warming, and very likely the temperature levels, are exceptional in the past 2,000 years, perhaps even longer.
The hockey stick is alive; long live the hockey stick. Climate denialists will have to find another excuse behind which to hide.
J.E.G.
PS: stay tuned for some exciting, smush-free results using this dataset and the framework of the Last Millennium Reanalysis.


You said the 20th century will stick out like a sore thumb. No doubt. But it may look like a pretty normal thumb once the 21st century is a bit further along.
small comfort…
Read Climate Audit: Steve McIntyre is back, and writing about you!
and getting it all wrong, as often: https://climateaudit.org/2017/07/11/pages2017-new-cherry-pie/#comment-773101
Very good stuff, thank you.
Just one comment: May I suggest that you avoid using the word “collective” to describe a collaborative group of scientists? While it is a perfectly good word, and means nothing more than a group of people working together cooperatively, it has developed certain negative connotations: There are many who immediately think “Communists!” (and, surely, some who think “the Borg!”).
It’s just the sort of thing some people will seize upon, allowing them to ignore everything else, which would be a shame.
All the best.
thanks @chrisd. I did not realize this offends anyone’s sensibility to such an extent.
Of course there is a hockeystick, trees like CO2 very much

True, but most proxies in the database don’t care about CO2. Trees do, to some extent, but that has been known for a long time, and you can control for that effect: can record year-to-year variations in temperature, which they won’t for CO2. Also, most look nothing like the CO2 curve over all or parts of the past millennium, so it’s a tenuous position to argue that CO2 availability is the main source of their growth variability.
JEG
Cool
You have an Rdata version
we do, and we welcome feedback on its usability, since it has been less field-tested than the Matlab or Python versions. You may also be interested in the LiPD utilities in R (https://github.com/nickmckay/LiPD-utilities/tree/master/R). If you want to contribute R code to analyze/visualize the database, know that we welcome all useful contributions.
Your SI contains a lengthy and not very clear comment on Hvitarvatn varve thickness – a series on which I’ve commented on several occasions at Climate Audit. Can you clarify its meaning?
It’s a series that I’ve commented on at considerable length. I pointed out that PAGES 2013 used it upside down to the orientation of original authors (Miller et al who supported their interpretation convincingly). McKay and Kaufman 2014 grudgingly conceded the error and inverted the series – but without acknowledging Climate Audit (a form of plagiarism) and without issuing a corrigendum to PAGES 2013.
I cannot help but note that the comment on Hvitarvatn in the SI was much longer and more inconclusive than other SI comments. I presume that this is not unrelated to the PAGES 2013 error.
In my commentary on Hvitarvatn, I had pointed out the remarkable similarity of the Hvitarvatn varve thickness series with Big Round Lake, Baffin Island varve thickness (inverted), a point later noted by Balascio et al 2015, who (sensibly) observed that the similarity pointed to a common cause. In a field where consistency between proxies is scarce, this consistency ought to be welcomed and used as a building block.
Unfortunately, this hasn’t happened, resulting in nonsense. McKay and Kaufman 2014 awkwardly used the two series with opposite orientations. The inconsistency was perpetuated in PAGES 2017, despite the intervening Balascio et al 2015. Werner et al conceal the inconsistency by deleting Hvitarvatn from their dataset, while keeping Big Round – even though far more is known about Hvitarvatn than Big Round.
A principled and consistent interpretation of varve thickness data is sorely lacking and long overdue.
Thanks Steve – this is the kind of feedback that moves things along, and I agree that redundancy/replication needs to be leveraged where appropriate. I was not aware of this particular issue – this is under the purview of the Arctic2k group, with whom I will confer to come to a timely resolution of this apparent contradiction.
Can you be more specific about the PAGES2k ID of the series in question? It will help me reach out to the right people. Referring to series only by the site name is ambiguous, because there can be more than one series from any location.
As to your perception of “plagiarism”, I was not involved in the Arctic2k paper. I can only comment on my own experience, and say that people are much more likely to acknowledge contributions if they come in a constructive form. Your addresses to the climate community are often needlessly insulting, and the “lynch mob” vibe at Climate Audit certainly does nothing to help matters. (one reason I don’t allow random trolls in my comments section)
Personally, I believe that we should give credit where credit is due, and this sort of “audit” is highly welcome in my book. If it turns out that you are on to something, I will make sure you get duly acknowledged in the ensuing correction(s). You can quote me on that.
Arc_030 and Arc_022. In this case, name also identifies. Look at http://www.climateaudit,org/tag/hvitarvatn
Thanks. Quick follow-up: I am still in talks with the Arc2k folks. Apparently the decision to include Hvitarvatn was less than unanimous, and I am trying to get to a resolution. Based on the little I have seen I would not have included the record, but I also defer to my colleagues, who know far more than I do. Some are still doing field work, so we should get back in business next week. Group inertia is inevitable with these collaborative endeavors, as much as it pains me. Thanks for your patience.
Actually Steve, maybe you never saw this PAGES2k 2013 corrigendum?
https://www.nature.com/ngeo/journal/v8/n12/full/ngeo2566.html
I quote “The authors thank D. Divine, S. McIntyre and K. Seftigen, who helped improve the Arctic temperature reconstruction by finding errors in the data set.”
I am not sure how much more explicit they could have been.
I hadnt seen this corrigendum until you drew it to my attention. My comment was made of McKay and Kaufman 2014. Following its publication, I wrote to Nature urging them to issue a corrigendum to PAGES 2013 on the grounds that McKay abd Kaufman was effectively a “backdoor” corrigendum of errors in PAGS 2013. I also objected to Nature about McKay and Kaufman appropriation without acknowledgement. Nature said that they’d look into it but I never heard back from them. The corrigendum appeared more than a year later and I was not notified.
So while, as you say, this is acknowledgement, please note that it came only after a written complaint to the journal and, if anything, confirms the validity of my prior complaint about McKay and Kaufman 2014.
If you assume the worst intentions you will always observe the worst actions. All I can tell you is that there was a correction and acknowledgements. I’m not sure what else you want, but apparently the community can’t give it to you.
a small point that you may want to tidy. Your SI shows negative orientation for both Lehmilampi and Hvitarvatn. Your archive assigns negative values to Lehmilampi (thus inverting) but not Hvitarvatn. This inconsistent setup will result in one or other series being shown opposite to intended orientation. If Lehmilampi, won’t matter; but Hvitarvatn does matter.
Thanks, we will look into it
Julien, Well, well, you’ve got a cordial relationship with Mr. McIntyre going. My congratulations. After the endless sniping from him and his fans directed at the Paleo community (which is still going on, as you allude to further up the comments thread).this seems positively surreal. Still, there’s the characteristic lack of graciousness in his failure to acknowledge the gratitude that the PAGES2 collective has expressed to him. 🙂
Well done for acknowledging the contributions that Steve has made, including the advice he gave you back in 2007! Long may this reconciliation last.
P.S. Feel free to excise the more, er,controversial material from this comment: Idon’t want to undermine the new entente.
Thank you, Bill H. I’m not sure there’s a great deal of cordiality, but there is respect, at least on my end, for Steve’s intellectual contributions. I can’t say I endorse the communication style, but he has much to complain about as well. As long as it results in better science, I can deal with it.
Thanks, Julien. I hereby retract my comment about Steve’s “lack of graciousness”. He did indeed acknowledge McKay and Kaufman’s expression of gratitude, but this acknowledgement was still in moderation at the time I wrote my previous comment at Strangeweather.
That’s partially my fault – I could be faster at moderating comments. This blog is not my full-time gig and directs to an inbox I don’t check everyday, though I probably should. That being said, I hardly see Steve’s acknowledgement as an act of gratitude, more a grudging recognition that he’d missed something important and had to find reasons to be displeased about. Grumpsters be grumpsters.
I’ve no complaints at all about when you moderate comments. Your blog is a haven of tranquillity by comparison with the huge number of rage-filled unmoderated climate “science” blogs.
series after series was rejected because it had a “negative relation to temperature”
only for tree-rings. that is because in some regions (e.g. Southwestern US), the main control on ring width is moisture, which is indirectly related to temperature. In dry years, the soil moisture deficit means that the surface energy solar inputs are mostly balanced by long-wave cooling and sensible heat fluxes, which both require surface temperature to rise. In those cases you see a negative correlation between ring-width and temperature, but that is a classic case of 2 variables being correlated because of a third latent variable (here, moisture) which exerts a more direct control. Makes sense?