The Curious Case of COVID Curiosity, Part 2

1 04 2021

In part 1 we saw how my candid curiosity got me into a Twitter fight of epic proportions. While unpleasant, it did have the positive side-effect of bringing actual experts into the fray, which helped dispel some of my misconceptions, and clarified the reasons for my own lack of enthusiasm for RNA-based COVID vaccines (the only ones currently available on the US market).

The premise for my questioning was that, while many proponents of COVID vaccination take it as an article of faith that it is the best way out of this mess, the case was less clear to me, and I (admittedly awkwardly) solicited the hive mind’s input on three questions:

Question 1: Do vaccines help reduce asymptomatic transmission?

Early in the pandemic, I had heard that asymptomatic transmission accounted for nearly 85% of infections, which is why I was so curious as to what vaccines do to such transmission. It was abundantly clear from clinical trials that vaccines protect individuals from developing severe forms of the illness, but if that didn’t translate into reduced transmission, I could not see how that alone was going to help us end the pandemic.  Sure, there is the argument that reducing viral load overall should reduce transmission, as expressed, for instance, in Tara Smith’s point #6:

Yet, working with climate models, I’m well acquainted with things that should work in theory, but don’t always, in practice, so it’s always a good idea to test before we trust. This is why I was so eager to see data on this, and lo and behold, Tara pointed to a very recent article which suggests:

previous receipt of an mRNA COVID-19 vaccine was associated with an 80% reduction of risk in asymptomatic COVID-19 in patients that have received 2 vaccines when compared to those who had not been vaccinated.

source: Tande et al, 2021

So yes, the mRNA-based vaccines used in the study (the Pfizer and Moderna ones) do appear to reduce transmission. That’s all was I asking for. In case you thought that was obvious, I hope you will grant me that there are worse crimes than not being aware of a paper that was published 5 days prior to consulting the hive mind. I doubt most of people screaming at me were even aware of it.

Perhaps they knew it did not matter so much? It appears that I was confusing two distinct concepts: pre-symptomatic vs symptomless transmission, though this is partly – I was told – because the two are often lumped together even by competent experts. Pre-symptomatic transmission is related to the fact that viral loads, and therefore contagiousness, appear to be highest in the few days prior to developing symptoms. Distinct from that, many individuals never develop any detectable symptoms, yet are able to infect others (“symptomless” transmission). It is that latter mode that I thought was responsible for 85% of transmission, but, in the words of a recent perspective in Science:

The prevalence of symptomless cases is not precisely established. Early studies reported that asymptomatic cases accounted for 30 to 80% of infections, but more recent data point to a rate of asymptomatic cases between 17 and 30%.

Rasmussen & Popescu, 2021

They go on to say:

Determining the true transmission capability of asymptomatic and presymptomatic cases is inherently complex, but knowledge gaps should not detract from acknowledging their role in the spread of SARS-CoV-2. [….] [E]mphasis on the degree of contagiousness rather than the knowledge that people without symptoms are generally contagious detracts from the public health threat that asymptomatic and presymptomatic infections pose and the need for continuous community-based surveillance and interventions.

Rasmussen & Popescu, 2021

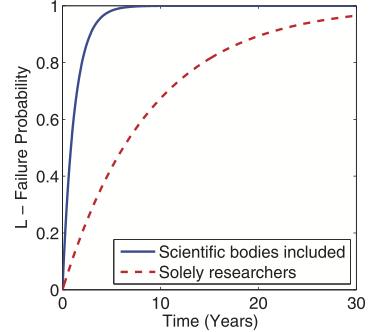
The figure below, from the same source, qualitatively describes what is presently known about this:

Viral replication and symptom onset The titer of infectious severe acute respiratory syndrome coronavirus 2 (SARS-CoV-2) and the amount of viral RNA are generally lower in asymptomatic (A) than presymptomatic (Pre) COVID-19. There is likely to be a threshold at which a person becomes contagious, but this is not known. In presymptomatic patients, symptoms usually begin when viral load peaks, so there is a period of infectiousness when a person has no symptoms. (Reproduced from Rasmussen & Popescu, 2021)

To me, what this means is that we will need to continue testing regularly to see if interventions (including vaccinations) are working. Indeed, if mass vaccination is successful, the end result will be that the overwhelming majority of residual transmission is carried out by individuals that exhibit weak to zero symptoms. Recent data make it clear that the two COVID vaccines presently used in the US should markedly help with reducing asymptomatic transmission. This fact wasn’t obvious to me last week (nor when Tara Smith wrote this piece), but now it is. Thank you, experts. Vaccines 1, hesitancy 0.

Question 2: Are the COVID-19 vaccines safe?

Here I got a little too quickly assimilated to a garden-variety anti-vaxxer, so let me make one thing clear. You can be 100% convinced of the thoroughly well-founded nature of vaccination while wanting more information on COVID vaccines. The reason is that mRNA vaccines are a very novel beast, so the sleight of hand that “vaccines are safe” (which, again, is true in general) does not imply that this is automatically the case here. To illustrate this, consider that Moderna had prior to COVID-19 been in the business of making such vaccines for about a decade and that the COVID vaccine is the first one that got approved by the FDA (under an Emergency Use Authorization, need I say). Many expect that COVID is the watershed moment for this technology; by allowing lightning fast design (Moderna started testing theirs a week after the wild COVID genome had been sequenced), it establishes the technology as uniquely suited to responding to rapidly-emerging pathogens and their mutations. Some expect it will durably change vaccine design, enabling flu shots to (finally) be responsive to whatever flu strain actually hits our shores, not the one models predict might emerge 6 months later. And yes, even mRNA vaccine enthusiasts will admit that the lipid nanoparticles that act as vectors for the genetic material have problematic side effects.

It’s therefore not entirely unreasonable to ask if those vaccines are safe. Naturally, the clinical trials were designed to test for that, and it’s remarkable that a vaccine developed in such a short time was able to clear those hurdles. But it is this very swiftness that gives some people pause about the vaccines. Yet, Tara Haelle argues that, given that one year of data has now accumulated:

If the Covid-19 vaccine caused long-term effects beyond the side effects reported in the trials, we would know about them by now.

Tara Haelle

This is where I must admit to being more conservative. One year is hardly an eternity, and indeed, the reason the vaccines are not being mandated right now is that, under FDA rules, you’d need at least 3 years of data to establish long-term safety. Moreover, there are documented instances of side effects that take longer to detect: the deadly history of Vioxx, which only surfaced after about 5 years on the market, comes to mind. So one could be forgiven for wondering whether one year really is enough to establish safety.

So how should one rationally evaluate a fundamentally new vaccine? Let us not indulge in our innate tendency for zero-risk bias. The house is on fire, and before we can think about redesigning the kitchen, we have to put out the fire. These mRNA vaccines appear to be our best shot at doing so, so this is clearly the lesser-evil.

Vaccines 2, hesitancy 0.

Question 3: how effective is the protection?

We now come to my third question: are the current vaccines the best way to quell the infection in the long-term? I had two concerns here:

  1. Re-infections are possible, casting doubt on the long-term protection provided by COVID antibodies, even if the virus is a fixed target.
  2. What’s more, the virus is very much a moving target. Some variants (most notably the one known as B.1.351, first identified in South Africa) are now accounting for 20-30% of new infections in the US, and are resistant to the Pfizer and Moderna vaccines (the latter, thankfully, work on variant B.1.1.7).

Leaving aside issues of access and distribution, it is hard to envision how, even under the most ideal of circumstances (e.g. scoundrels like myself impaling themselves onto the first vaccine-laden syringe in sight), vaccines could bring about the much sought-after herd immunity. Unlike measles, where the pathogen is essentially fixed and antibody protection lasts for years, fighting this Learnean hydra with a single weapon seems a losing battle, and I wanted reassurance that there was a more cunning plan in the works.

Zeynep Tufekci writes:

The solution is obvious and doable: We should immediately match variant surges with vaccination surges that target the most vulnerable by going where they are, in the cities and states experiencing active outbreaks—an effort modeled on a public-health tool called “ring vaccination.” Ring vaccination involves vaccinating contacts and potential contacts of cases, essentially smothering the outbreak by surrounding it with immunity. We should do this, but on a surge scale, essentially ring-vaccinating whole cities and even states.

That makes a lot of sense to me, and this is something I can get excited about. Indeed, I suggested something similar, and got called all kinds of names for it.

Last month, Moderna shipped a cocktail of such vaccines to the NIH for clinical study. It’s unclear how large those trials will be, though if there has been one silver lining with the calamitous handling of the pandemic by the Trump administration, it is that there are no shortage of individuals and opportunities for infections to conduct large clinical trials. I can imagine that, as we learn about these new variants and as models help forecast their diffusion in the population, we might be able to continuously adjust the vaccine to keep hitting this moving target. This appears a significant advantage of mRNA-based vaccines over traditional, protein-subunit vaccines; the infrastructure is flexible enough that it allows to quickly load a “patch” to the operating system, and ensure that the vaccines do protect against the most relevant strains of the virus. Caveats about long-term safety still apply, but it seems fair to assume that the risk profile will be similar regardless of what exact RNA sequence is being included in the vector (as the side affects are thought to be related to the lipid nanoparticles that encapsulate those sequences).

Still, for this game to work, you’d have to vaccine all eligible individuals very regularly, to stamp out any opportunity for the virus to spread and mutate. This may be possible in the type of altruistic utopia I’ve previously written about, but the US and other “First World” nations have definitely taken a “Me First” approach to this (as usual), and until that changes, there will be unprotected populations where the virus is free to evolve. And somehow, even under the restrictive policies put in place in my home state of California, international travel was always a bigger priority than kids going to school, so we gave up long ago on containing the virus to any part of the world (the ethics of which are repugnant anyway). So while the vaccine seems like the best way to tame the fire in the US, it’s unclear to me whether it will truly extinguish it. That is why more knowledgeable people than me have been warning of a permanent pandemic. Much of this may be have been obvious to you long ago, so you may wonder why I am wasting precious time rehashing old news. As I hope to have illustrated through this partial set of examples, much of the news are still rather fresh; forgive me if it takes me a few weeks to adjust.

So where do we stand? With help from the Knowing Taras and some digging of my own, I am now 100% convinced that mRNA-based vaccines are our best bet at controlling the pandemic in the short term. But since I’m a long-term kind of guy (I study climate change over scales of years to millennia for a living), forgive me if I close these reflections with thoughts for the long-term.

Beyond Vaccines

I’d be setting up a strawman if I said that all vaccine enthusiasts see COVID vaccination as a necessary and sufficient condition to get back to “normal”, but I’ve definitely met people who do, and there are a few problems with that worldview. Below I outline a few reasons to be wary of a strategy that prioritizes vaccination at the exclusion of any other solution. Once again, please don’t paint me with the seal of anti-vaxxer infamy for saying that: I do believe vaccines are useful; I just don’t see them as the be-all-end-all that so many people desperately want them to be.

Normal wasn’t that great for everyone

To me, the great lesson of COVID-19 is one of inequality: the pandemic has magnified pre-existing health disparities, like diabetes or obesity, which largely map onto economic and environmental disparities, themselves mapping largely onto racial lines, with Latino, Back or Indigenous communities having suffered the greatest losses. These disparities won’t go away once 85%+ of the US population (including myself) gets vaccinated. Getting back to the pre-2020 norm is only an enticing prospect if that norm is remotely fair, which it never was: African Americans were being poisoned by lead in Flint, MI; kids in poor LA neighborhoods were at higher risk of asthma, the list goes on. To me, COVID’s co-morbidities call for a renewed focus on the social and environmental determinants of health, including access to clean water, clean air, clean food, exercise, and a holistic understanding of health. That isn’t quite the message sent by many companies promising free glazed donuts, beer, or popcorn for getting vaccinated. Yes, I too yearn for resuming social activities, but this sounds a lot like consumerism. And in case you haven’t noticed, COVID is associated with the very same co-morbidities as consumerism, namely obesity, type II diabetes, smoking, and others. Do we have a societal plan for truly addressing that?

No Silver Bullet

Given that not everyone can be vaccinated, vaccines are therefore a partial shield against infection (a useful one, for sure). Thus, it only makes sense as part of a broader strategy to truly address the root causes of COVID inequality (i.e. why some people get so much sicker than others). I’m sure some health practitioners see it that way as well, but that is conspicuously absent from the public conversation. This concerns me, because it risks setting up impossible expectations around vaccines that could backfire. And once again, I think vaccines are awesome, just not a substitute for healthy living.

To return to a climate analogy, a vaccine-only strategy against COVID is like a strategy against anthropogenic global warming that would rely on solar radiation management, say. In both cases, it is treating symptoms, using interventions that fail to address the root cause of the problem (in the case of climate change: carbon emissions), a techno-fix mediated by for-profit companies, allowing society to function largely as it did before, without any fundamental reorganization or rethinking. Treating symptoms is something our industrial societies are very good at doing, and I was hoping this pandemic would force us to focus more on underlying causes. Looks like we’re not quite there yet.

Health Fundamentals

The other great lesson of COVID, for me, is one of humility: yes, it is amazing that not one, but two 95% effective vaccine clearing phase 3 clinical trials was developed under 9 months. Yay science. But I also remain very curious about all the unknowns of this virus: why does it steamroll some seemingly healthy individuals while leaving others in comparable demographics completely unscathed? Why do some people recover quickly while some get mired in a “long COVID” nightmare? I don’t claim to have my finger on the pulse of that literature, but everything I have read suggests that we know very little about those fundamentals. SARS-CoV-2 has exposed some deep gaps in our understanding of the human body, and all the trumpets and fanfare about vaccine development (it’s cool, I get it) should not detract from the fact that our understanding of health is still worryingly incomplete. Going back to the climate analogy, it would be like trusting a model-based climate intervention based on models that can’t satisfactorily represent the modern-day climate.

This is more than an issue of modeling. It goes to the very core philosophy. Indeed, one of the central tenets of Western medicine is that:

all bodies respond roughly the same way to infection or injury, and the immune system is a well-organized defense mechanism that never attacks the body. […] The framework dates back to the embrace of germ theory in the late 19th century. The idea that many illnesses are caused by an observable pathogen, which produces distinct and predictable symptoms, had a dramatic clarity to it. It pushed Western medicine away from an earlier holistic emphasis on the role an individual’s constitution played in illness. According to the new view, infection was determined by a specific and measurable entity. Focus had shifted from the soil to the seed, as it were.

Meghan O’Rourke, Can Long COVID be treated?

This philosophy has been extraordinarily effective for some pathologies (like childhood infectious diseases), far more effective than competing systems like traditional Chinese medicine or Ayurvedic medicine. However, the mysteries of long COVID, and other ones, should be cause for a little humility. In the same article, Megan O’Rourke draws parallel between long COVID and other ill-understood pathologies that are often undiagnosed or written off, either associated with the long after-effects of viral infections (Epstein-Barr, influenza) or chronic conditions like myalgic encephalomyelitis/chronic fatigue syndrome. She writes:

many researchers I spoke with believe that the race to understand long COVID will advance our understanding of chronic conditions that follow infection, transforming medicine in the process.

Meghan O’Rourke, Can Long COVID be treated?

Few serious medical practitioners would dispute that there are a several things for which Western medicine has no good theory. Here are three that I believe pertinent to COVID19:

  1. the placebo effect (it’s undeniable, yet we can’t explain it)
  2. auto-immune diseases
  3. the innocuous common cold (some variants are which are caused by human coronaviruses).

To me, these are pretty fundamental things; I’d be wary of putting all my trust into a system that cannot account for that. If you think it makes me “anti-science” to acknowledge the current limits of Western science, then you’re part of why that understanding is limited. I have faith in the process of science to (eventually) reach more and more complete explanations of the world, but this can only happen if we are honest about knowledge gaps. I don’t have indiscriminate faith in all the solutions currently provided by allopathic medicine, especially when said solutions are so transparently tied to the profit motive. What’s the alternative, you say?

The Science of Breath

“Alternative” medicine is any medicine that Western medical doctors didn’t learn in school, much like “World music” is a Western moniker for any music that isn’t classical, jazz, rock and hip-hop, pretty much; that is to say, most music created by humankind. In the same article on “long COVID”, I was struck to read that some of the immune and cardiac symptoms experienced by patients were tied to dysautonomia, an “impairment of the usual functioning of the autonomic nervous system, which controls blood pressure, temperature regulation, and digestion. ” For thousands of years, these are processes that yogis have learned to control by manipulating one of our most essential biological functions, and one that a respiratory syndrome like SARS-CoV-2 attacks most violently: the breath. The logic for using the breath is deceptively simple: breathing is a largely autonomous function over which we have conscious control. It therefore provides a backdoor to the operating system of our body and mind – such is the central claim of pranayama, the science of breath. If you like to scorn ancient wisdom, be reassured: the book I just linked to was co-authored by two competent MDs.

Continuing the article, I therefore wasn’t too surprised to learn that some patients experienced dramatic improvements by practicing breathing exercises, in this case the Stasis program which “involves inhaling and exhaling through your nose in prescribed counts in the morning and at night.” The paper version of the article included a helpful visualization of this process, which the online version unfortunately left out. Though it is different in detail, it reminded me of a pranayama technique called kumbhaka, one variant of which is described here.

This would not be the first time that Westerners “discover” ancient knowledge: meditation used to be a woo-woo oddity reserved for Tibetan monks and Westerners who’ve lost their way. Now it’s all the rage in even the most conservative corporations. Yoga used to be a weird practice for pretzel-legged sadhus; now you can get your health insurance to subsidize your membership at the local studio (it helped my sciatica better than any drug could have). The list goes on. If the West has caught up, in just a few decades, on knowledge that Yogic and Tibetan scriptures have documented for thousands of years, there is hope! Perhaps in the next decade allopathic medicine will catch on to the importance of breath? If it took COVID to get there, maybe that will have been worth it. Either way, I practice various breathing techniques daily, and the Long Quarantine only further crystallized its importance in my life.

Before getting further misunderstood, let me make this plain: I’m not saying that this or that breathing technique will cure COVID. What I am saying is that the ancient knowledge of pranayama (and, more generally, the contemplative traditions of the East), which is periodically co-opted and repackaged by Western health practitioners (for a fee), can prove surprisingly effective where allopathic medicine fails miserably. It’s – at the very least – worth a shot, given the rather favorable risk profile of breathing (even intensely) compared to any imaginable pharmaceutical intervention. In the article, several patients reported that those breath manipulations had helped them like nothing else, though it is still a very long climb back up for many of them.

There are many more dimensions to building a health system that’s truly about Health, and not just Sickness. They will have to wait for another post (or rather, a true expert on the matter). I now want to address what I believe caused the strong allergic reaction to my original thread.

I don’t speak for the trees (or geoscientists)

My biggest fault (aside from unwisely rousing the Twitter monster with poorly considered words) lies in casting those words as “my Earth Science position on the matter.” To clarify, this has nothing to do with the Earth Sciences. I do not have the right to speak for my community on any topic, much less a topic in which I have not been trained. I believe that is why so many in my community took issue with the thread; had I not done this, I can only assume that the disagreement would have been voiced more politely. If you are one of those geoscientists who felt singularly misrepresented by my words, please receive my sincere apologies. I do not speak for geoscientists.

What this is about is the process of making decisions in the face of much uncertainty and urgency. As a climate scientist I have longed been exasperated that some people, after all this time, are still skeptical of the unequivocal human influence on climate. I have voiced that impatience many times, including on this blog. What this experience has taught me is that it is not overly pleasant being on the other side of that table: trying to make a rational decision about so consequential a topic in the midst of a health crisis is a recipe for cognitive biases (particularly the affect heuristic) to kick in, leaving minds particularly prone to bad decisions. What I was attempting was an experiment in self-awareness, a journey through the meanderings of decision-making, drawing on friends that I hoped as evidence-minded as I am to share with me the evidence that convinced them.

I can understand that those who had made up their mind long ago, perhaps drawing on more scholarship than I did, would find this process useless at best, or even overindulgent. Some went so far as to call it dangerous or harmful, which is vastly overstating my social media reach. Yet, I hope documenting this process will be of use for those who still find themselves hesitant to take the COVID vaccine plunge. An interesting lesson I drew from the (biased) sample of responders is that they were more royalist than the king: the default position appears to be “how dare you question experts?”, while the two actual experts that got dragged into the thread (the Knowing Taras) revealed themselves much more tolerant of my curiosity. No doubt sample size is insufficient to draw very reliable conclusions here; yet, it made me wonder why some of my fellow climate scientists were so quick to shut down anything remotely redolent of disbelieving an expert consensus.

After decades of being outmaneuvered by climate denialists in the court of public opinion, I can certainly sympathize with the sentiment of many climate scientists (“oh no, not again!”) and the knee-jerk reaction it inspired. Yet, what I learned through unwittingly turning the tables (suddenly becoming the questioning non-expert thrust in front of several sharp-tongued climate scientists) is that “trust experts and shut up” is a really ineffective form of science communication. It did not work on me, and it does not, apparently, work on many people. That is one reason why we are still struggling in the court of public opinion in communicating just how much how damn effing sure we are that human activities are warming the Earth. Beyond the diabolical efficacy of the Merchants of Doubt at obscuring this consensus, it is clear that the generalized mistrust of all manner of experts flies in the face of a “trust experts and shut up” communication strategy. I am not saying there is a universal answer, but starting from an assumption of good faith might not be the worst thing in the world.

Certainly the Knowing Taras engaged in a much more productive dialogue, one that will inspire me, in the future, to be an expert worth consulting without getting yelled at. I think we’ll all appear more trustworthy if we start there.

So, am I getting vaccinated?

Yes, indeed I am. I ‘d be lying if I said that I experience vaccine envy, for reasons mentioned above. But at this point it would be foolish to deny that the pros of vaccination so forcefully outweigh the cons. I’ll be getting vaccinated and I’ll post about it. But I’ll also keep taking care of my health and I hope you do the same. If I hadn’t quit drinking during this pandemic, I’d raise a glass to your good health.

Thank you for reading this far. (Civil) comments are welcome.


The Curious Case of COVID Curiosity, Part 1

21 03 2021

Emotions have been riding high this week. Aside from the usual avalanche of awful news, including yet another heinous gun-facilitated hate crime, many are contemplating the one year anniversary of the first wave lockdowns in the US, marked mostly by the epic failures of a science-denying president. Since then, COVID19 has replaced heart disease as the lead cause of death in the US, the economy is in shambles, kids (and their parents) are losing their mind, and many people are hanging on for dear life until society reopens and they can go back to their old life. One can definitely be forgiven for being emotional about that.

In that context, it was a less than obvious choice for me to pick a Twitter fight with the World about COVID vaccines. To be fair, I did not intend on picking a Twitter fight with the World, but with the current state of the World (see above), the known proclivity of the platform for facilitating outrage, the spontaneity with which I wrote that thread, and the contentious nature of the claims I made therein, the outcome should, in hindsight have been obvious to any half-wit. It’s not that I didn’t see it coming; it’s more that I considered it an interesting experiment to run.

In this blog post, I take stock of lessons learned. If you’re expecting a self-flagellation, this will be an even more disappointing post than the original thread: while I will definitely admit to some unwise choices, the crux of my point is that any reasonable person should be allowed to ask reasonable questions, and I feel vindicated that the epidemiologists who got dragged into the fight saw them as such. I’ve also received quite a few private (and public) messages from people who, while they disagree, recognize that curiosity is a fundamental right.

Origin Story

Here’s how the thread germinated. A colleague concluded an email (on a wholly unrelated subject) by the innocuous “Am happy to be getting my second Pfizer jab next Tuesday“. My initial instinct was to reply that I did not, actually, feel quite as excited as most people around me (academics, for the most part), and I was beginning to feel like an outlier about it. Instead of replying to her alone, I decided to open up to the world about my thought process. You might think that a strange choice in itself, especially if there is a risk that the thought process in question could be distorted by the Twitterverse. However, that is something I’ve done before, in an even more controversial sphere: politics. During the 2016 primary campaign, I publicly asked my network what was so exciting about Hillary’s candidacy. The process allowed me to hear from people who were, and that helped me get over my reservations (and of course, I did vote for Hillary in the general election. Duh). I was therefore positively inclined to consulting the hive mind thusly again.

Now, the first fault I’ll admit was that, given the potential for misinterpretations/misunderstanding, I could have been a lot more careful about how I phrased said thought process. However, given some of the ensuing simplifications that were made, I am not convinced it would have been 95% effective (or even 50%, for that matter). But it certainly would have limited the potential for misunderstanding, and (since some persist in believing that merely publishing those thoughts was like yelling fire in a crowded theater), it would have limited harm, if any harm truly was done.

Ain’t no anti-vaxxer

The first misconception I want to clear up is that I’m not an anti-vaxxer, thank you very much. I’ve received every vaccine that doctors have ever wanted to put into my arm, and so has my kid. I’ll go so far as to say that vaccination is one of humanity’s most significant inventions, and that given the established efficacy and safety of most of them (e.g. the measles vaccine) it’s a downright shame that we don’t have the whole human population vaccinated against measles (and other childhood diseases).

The irony is that, as the world entered a misinformation crisis in 2015-2016, culminating in the rise of pants-on-fire propagandist strongmen like Trump, Farage, Bolsonaro, Modi and others, I sought to play a more active role in dispelling misinformation. More active, that is, than being a research-active climate scientist, and one with a history fighting climate misconceptions on social media, on this blog, or anywhere a hot mic was left on for me to speak into. In that context, I put together a whole new class just to that effect. One of the central tenets of the class is that one must trust experts on their topic of expertise, but also that a basic acumen with data science and statistics can serve you well in life, especially in cases where the scientific consensus is not readily appraised (unlike, say, anthropogenic climate change, where the consensus is overwhelming and based on decades of research), or when said consensus is being challenged by what appear, at first glance, to be legitimate experts.

The class started with a survey of common and persistent misconceptions, as well as their origins; a case in point was the modern anti-vaccine movement, which seems to have originated in a super shady 1998 study led by Andrew Wakefield (since retracted). That the study was ever published, with a correlation based on n = 12 samples as the sole basis for the claim, and zero mechanism to back it up, doesn’t reflect particularly well on The Lancet’s editorial policies, but I digress.

The point is not lost on me that, in this case in particular, retracting the claims has had very little impact over the myth that the measles vaccines has any association whatsoever with autism. The harm was done by simply allowing that claim to be out there for enough people to see an amplify. Isn’t that what I just did on Twitter?

Well, no. First, I did not brandish the mantle of intellectual authority about epidemiology. Ain’t no anti-vaxxer, and ain’t no epidemiologist either. I never once questioned the broad enterprise of vaccination, as should be clear from the above. What I did was to question how effective and safe were the COVID vaccines currently on the market at containing or even eradicating the pandemic (more on this later). Some people took umbrage at this because they think the case has been made abundantly clear for months, so what little entitled shit am I to dare question the judgement of the FDA, CDC, and other authorities?

All I did was ask my network what evidence had persuaded them to take the vaccine. We need people fully on board if we want them to participate in broad and effective collective action. This is as true for climate change as it is for vaccination. Call me naive, but I firmly believe that any reasonably intelligent individual should be allowed to make up their mind on issues when given the facts of the case. That is the basis of our justice system, after all. If we start infantilizing people and asking them to blindly trust what authority figures are saying, “just because”, well … you see how that’s going, on climate, vaccines, or almost any other topic. As a climate scientist, I have a duty to make the facts of the case known, and I can’t blame people who ask for it. If the case is strong, the public conversation is only enriched by repeating it in as many venues as possible.

However, one lesson from this Twitter experiment is how quickly some of my colleagues will default to barking “How dare you question experts?”, without pausing to consider what makes the arguments worth listening to. Certainly, this is making me reflect on how I have communicated about climate change in the past, and how I should do so in the future.

The Greater Good

Let’s get to the core of my argument. People have all sorts of motives for wanting to get vaccinated against COVID; many because they fear for their life or those around them, which I fully understand. I am certainly privileged not to be in that category. I was healthy to begin with, and I have taken care of my health in the past year as best as I could despite the ongoing closure of gyms and yoga studios in California (where they are not a small part of the economy). I even quit drinking the little alcohol I used to drink, because drinking at home ain’t no fun. I am lucky enough to have been able to keep my job and do it remotely, even though it hasn’t exactly been a party every day, particularly on the childcare front (perhaps you can relate, Dear Reader?). So many have it so, so much worse.

I’m also incredibly privileged that I don’t personally know anyone who has come down with a debilitating or fatal pathology of the disease, though, of course, I’ve read about those. Still, it’s always been incredibly obvious to me that the first duty of well people is to protect the less well, so I have dutifully observed public health recommendations regarding social-distancing, mask-wearing, hand hygiene and the like. I mean, what asshole wouldn’t?

Based in part on statistics that are less than alarming for my demographic, I do not fear for my life or health as far as this virus is concerned. That is, I do not fear it any more than any of the other risk factors in my life, because living in constant fear is not particularly conducive to, well, living. You may view that stance as being just as asinine as Trump’s insistence that he just wasn’t going to come down with the disease despite recklessly gathering large number of people without observing basic precautions (with the result that we know), but I am just being forthright. In any instance of decision-making, it’s important to state our prior, and my prior is that I do not fear this virus for me or people in my household. I haven’t seen my wider family in 3 years (thanks in part to the travel restrictions of this pandemic), and the very few people I’ve interacted with in the past year have been just as virus-free as I have (we test every week, and every test has come back negative). Contact-tracing has also informed me that I’ve been exposed to the virus without ever showing signs of catching the disease. Perhaps unwisely, this leads me to think I’m not abnormally susceptible to it.

Wisely or not, thus, the only psychological incentive I feel to vaccinate is because it would be the right thing to do: If vaccines are what’s going to get us out of this mess the fastest, and save lives without creating more problems than they solve, then OF FRICKING COURSE that’s what we should do, as a society. I hope this gives you satisfactory insights into my motivations.

Now, there are a number of underlying assumptions in the above clause, which I’ll break down as follows:

  1. Current COVID vaccines help reduce transmission
  2. Current COVID vaccines are safe
  3. Vaccinating the greatest number of people is our best defense against future flare-ups

Though it could have been phrased more clearly, my question to the Twitterverse was: what evidence have you seen that convinced you of these three points? Again, readers of the thread could be forgiven for not having understood that my motive was, indeed, altruistic, and that I was genuinely asking for evidence. Once thing I have learned as a climate scientist is that simply asking people to “trust the experts” is a losing proposition. But if there is adundant evidence at hand, why not show it?

Consent is Sexy

Before we examine the evidence that was shared, I’d like to express one more motivation for asking those questions publicly, which have to do with consent. It appears that many who reacted epidermically to my thread seem to think that if a medical expert recommends a course of action, that should be good enough for the rest of us.

I’ve never been in that boat. To me, informed consent is of paramount importance, and though it’s what the medical establishment supposedly goes by, I never cease to be amazed by how trivialized the notion is in the hands of some practitioners, ready to inject me with unknown substances or pulling out a tooth without actually explaining why that is necessary in the first place. The underlying condescension is something that revolts me, and something, I realize, many climate scientists are just as guilty of when they ask society to change their lifestyle “just because the experts say so”. Yes, we all have to rely on the judgment of experts to solve complex problems, but is it that unreasonable to ask the experts to tell us why they recommend what they do? The argument that many made on my Twitter thread is that those arguments have been made for months, and I’m either an uninformed jackass or a thick-skulled knucklehead for even daring to question the party line.

So let me make one thing very clear: I do trust experts so very much. I trust them to respect our intelligence and to explain to us what they know and how they know it. And as an expert, I think people are entitled to ask the very same things of me (though, of course, it goes better when they ask nicely). My initial thread would have gone down a lot easier if that intention had been better communicated. For that, I apologize. But for asking questions, I do not. Consent is sexy, and if experts are asking people to accept an invasive intervention (like decarbonizing our economy, or being injected with genetic material from a foreign species), they should be ready to answer good faith questions from said people.

The experts weigh in

Fortunately, my colleague Jacquelyn Gill called two card-carrying epidemiologists, Tara Haelle and Tara C. Smith (aka “Knowing Taras”), to the rescue. Tara H. was first to the podium:

Despite calls by some fellow geoscientists to have me carted away in a straight jacket, it felt validating to hear from a card-carrying expert that those were, indeed, legitimate questions to ask, and that asking them wasn’t tantamount to inciting a violent mob on the Capitol. As if on cue, Tara Smith then jumped into the fray and delivered what I consider to be a model of science communication: 

What more could I ask for? That was precisely what I was hoping would happen: either someone in my network would point me to some cogent evidence addressing my question, or they would call in a knowledgeable expert to do so. 

There’s a lot to unpack there, so I’ll devote Part 2 to commenting on the 3 questions above, weaving in information obtained from regular sources (mostly, the New York Times, the Atlantic, both of which I subscribe to), as well as resources sent by the Knowing Taras (in back-channel communications, given the obvious toxicity of the Twitterverse for public communication on the topic).

If you’ve read this far, kudos. You are welcome to take a break.


Bayesian Immunity

29 04 2020

Probability is the only satisfactory way to reason in an uncertain world.

Dennis Lindley

An elementary notion in probability is Bayes’ rule, named after the reverend Thomas Bayes, who probably did not discover it. Bayes rule is about flipping conditionals: if I know the probability of event A given that event B has occurred, what’s the probability of B given that A has occurred? That probability is a big neon sign:

A neon sign showing the simple statement of Bayes’ theorem at the offices of HP Autonomy. Credit: Matt Buck.

On the face of it, Bayes’ rule is a tautology, basically a restatement of the chain rule. But it is in fact fundamental to all kinds of inference, from robots learning about their environment from sensors, to recommender systems for movies, to a lot of machine learning, criminal justice, and medical diagnostics.

It is a depressing fact of modern medicine that most medical professionals incorrectly apply the results of diagnostic tests. Imagine that you have a test that is 99% sensitive (meaning it correctly identifies 99% of people who have a condition) and 99% specific (meaning that it incorrectly identifies people who do not have that condition as having it only 1% of the time). Say you take the test and the result comes back positive, what is the probability that you actually have the disease? Most people (including a frightening number of doctors) will say 99%. But that is missing a key part of the equation: the prior odds. That is, if the condition is extremely rare (say 0.1% of the population), then the majority of people who test positive (10/11) do not actually have that condition. In this scenario, somebody who tests positive only has a 1/11 chance of having the disease. Pretty different from 99%, wouldn’t you say? If you are curious, this video gives a good illustration of why the maths works out that way.

Now, Bayes applied to medical diagnoses is nothing new, and indeed the subject of almost any tutorial on Bayes’ rule. The reason why I am bringing it up today is that there is increasing hope placed on antibody testing to help end the COVID-19 pandemic. Some observers are even imagining fairly dystopian scenarios in which the world would be segregated in a two-tier society: those immune to the virus, and those still at risk. They (and others) even imagine extreme measures by which people might be tempted to voluntarily get infected to develop immunity (assuming, of course, that they don’t die).

Those extreme scenarios aside, I thought the topic was a good one for my “Lies, Damned lies and statistics” class, where I basically restate Bayes’ theorem a 100 different ways until students get it. I thought I would share the problem here, since Bayes’ theorem, basic though it is, is still so widely underappreciated in decision-making, even when lives are literally at play.

Let’s say you manage workers that might be exposed to SARS-CoV2, and you would like to make sure to send only workers that are immune to it to those risk environments. A worker shows up with an “immunity passport”, the result of a positive antibody test (T+) that has 99% sensitivity and 95% specificity (that’s optimistic given current tests, but again, this is for argument’s sake). What is the probability that they actually are immune to the virus?

Let’s translate this in math. “99% sensitivity” means that the conditional probability of testing positive given that you are immune is: P(T^+|I) = 0.99. Similarly, “95% specificity” means that the probability of testing positive given that you are not immune P(T^+|\bar{I}) 
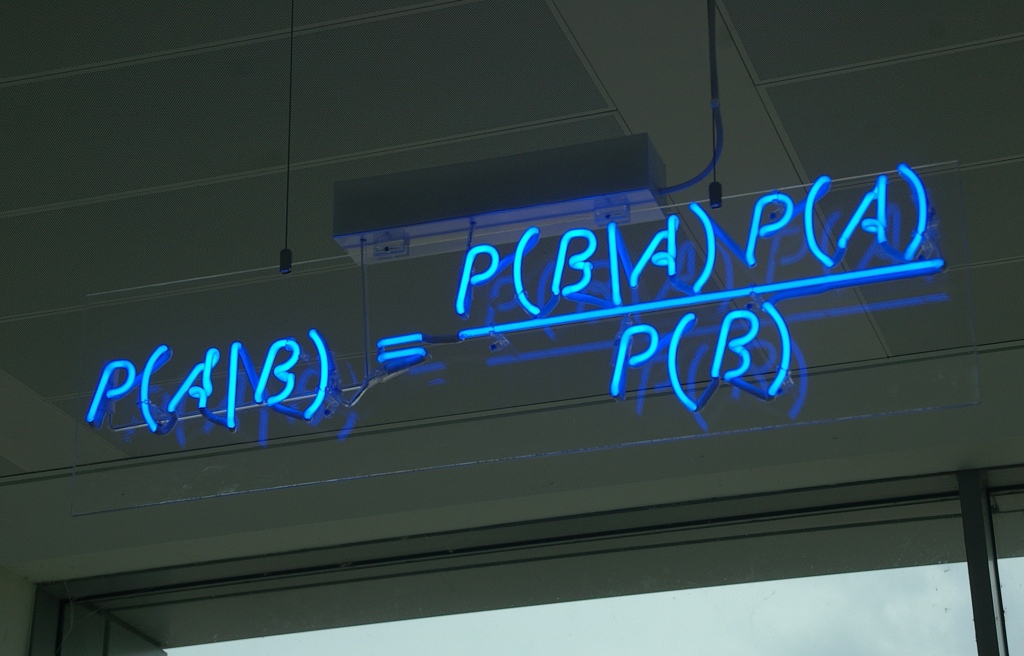
is 0.05. Bayes’ rule (rephrased from the neon sign above), is:

P(I|T^+) = \frac{P(T^+|I) P(I)}{P(T^+|I) P(I) +P(T^+|\bar{I}) P(\bar{I}) }

The probability we seek (being immunse given that the test is positive) is a combination of four numbers : P(T^+|I) and P(T^+|\bar{I}) which characterize the test’s accuracy, and crucially, P(I), the probability of being immune in the first place, as well as P(\bar{I}), the probability of not being immune. Now, obviously, we have the simple relation that P(\bar{I}) = 1 - P(I), so the last piece of of the puzzle is knowing P(I). In the case of a brand new disease like COVID-19 it’s an unknown variable, which I am going to denote p, and for which another name might be herd immunity. Now, we can rewrite Bayes’ rule as:

P(I|T^+) = \frac{0.99 p}{0.99 p + 0.05 (1-p)}

which is a closed-form function of the herd immunity parameter p. So, just as before, it’s not just about how accurate the test is; it’s also, crucially, about how prevalent the condition is. To see this, let’s plot this relationship:

Probability of being immune given a positive test, as a function of herd immunity parameter, p. The gray dashed line shows the state of knowledge in the absence of observations.

 We see that for low herd immunity (say, 5%), even a reliable test doesn’t give you a very good guarantee that an immunity marker is synonymous with immunity: the posterior probability is only 49%, so you’d have better odds with a coin flip (50%). Still, 49% is nearly 10 times better than 5%, which shows you how much information the data added to your mental picture: you started from the prior (gray dashed line), and the evidence (here, the antibody test), brought you up to the blue line, which is considerably closer to 1 — though perhaps nowhere near as close as you were hoping. 

Indeed, you might be loath to make potentially life-or-death decisions based on a 49% probability. What would it take to bring that probability to 95%, say? Two ways:

  • With this kind of test accuracy, once herd immunity passes 50%, the posterior is above 95%. 
  • If you can’t wait until then, the only way to boost the posterior is to make the test radically more accurate. 

Below is a case where the rate of false positives has been brought down from 5% to 1% (that is, the test is now 99% specific):

Same as before, but the red curve explores a scenario where the false positive rate is 1%, versus 5% in the blue curve seen above.

We see that limiting erroneous diagnoses (false positives) really brings up the posterior probability, particularly for low herd immunity. Yet, for a herd immunity below 20%, that is still not quite enough to reach 95% certainty.

So, like all medical diagnostics, and more broadly speaking all detection problems, it’s not only about the accuracy of test, but also the prevalence of the condition you are trying to diagnose. For well-established diseases, the incidence rate is often sufficiently well-characterized that it’s not a limiting factor in decision-making. But in this case, it is: we have to know both how good the test is (e.g. from laboratory experiments) and how prevalent herd immunity is at the time the test is made. We cannot do that without independent information about who has the virus or not (from independent tests such as a PCR-based one).

So I cannot imagine that any rational agent will rely on antibody tests to make these kinds of decisions anytime soon — not until we have much more information about herd immunity. That being said, the Trump administration is notorious for making irrational decisions about nearly everything, so we might very soon be using antibody tests as if they told us everything we want to know. At least, thanks to Bayes, we’ll have the intellectual satisfaction of knowing exactly how dumb that was. In an age of radical anti-intellectualism, that seems to be the only satisfaction left to intellectuals.


Volcanism & climate, part 2

27 03 2020

A lot of volcanic updates this week (see: part 1)! The academics among you know how slowly its creaky wheels can move at times. What follows is a lesson in patience and persistence.

The story starts in 2005, when my PhD advisor Mark Cane suggested that I use his famed model of El Niño-Southern Oscillation (ENSO) to understand the behavior of ENSO over the Holocene. Out of this came two papers: one focusing on the potential role of solar variability to explain millennial-scale climate oscillations; the other on the response of ENSO to volcanic forcing. Both were inspired by work done by Michael Mann, Mark and a few others, shortly before then.

That experience gave me a taste for two things: (1) it was a lot more fun to work with simple models, which can be understood and run quite fast, compared with big berthas like General Circulation Models — I am forever grateful that I don’t have to run those myself; (2) fun though it is to play with models, I was far more interested in seeing if these experiments in silico could explain any aspect of the natural world.

That pre-supposed that one knew, in fact, what had happened in the real world over the past few thousands of years. Given that we don’t even have adequate data coverage for the 1877 El Niño, this was a tall order. That got me crawling down the rabbit hole of collating information from various proxies about the state of ENSO over the past 10,000 years. I have never left that rabbit hole, and I’m now writing from there, with attendant benefits for social distancing.

Paleo ENSO

Both of the papers mentioned above (Emile-Geay et al 2007; Emile-Geay et al 2008) attempted the somewhat foolhardy exercise of manually compiling cherry-picked ENSO proxies and comparing them to model output. It quickly became obvious that it was as dumb as it was tedious: for instance, while we found some support in certain proxies for something like an El Niño event in 1258/59 (corresponding to the Samalas eruption, and in line with the predictions of the Cane-Zebiak model I was running), that could have been the result of chance alone. Indeed, in any given year, there’s about a 30% chance of experiencing El Niño conditions, so getting a match isn’t exactly cause for celebration.

I was thus hopelessly excited when the great Kim Cobb contacted me to work on better constraining the state of ENSO over the past millennium, thanks to a NOAA grant she had just received. Kim had risen to rockstar-level fame for her 2003 paper that presented the first evidence of sea-surface temperature variations from the heart of the tropical Pacific over the past millennium. In it, she had analyzed the isotopic composition of oxygen in coral skeletons left on the beautiful beaches of the Line Islands: Palmyra, Christmas and Fanning. This composition revealed a highly variable El Niño over the the past millennium, in several discrete windows corresponding to the period the time the corals had lived through (black curve below). What was especially impressive is that the data were monthly, giving insight into the full ENSO cycle for hundreds of years. To be sure, there had been many studies with monthly coral isotopic data before, but none from the heart of the tropical Pacific or covering quite as much of the past millennium.

Fig 5 from Cobb et al 2003. The monthly Palmyra coral d18O records are in (b) as a thin black line, shown with a 10-yr running average (thick yellow line).

I ended up going to Georgia Tech to work with Kim for my postdoc (2006-2008), and after trials and tribulations, we published a set of updated reconstructions of the NINO3.4 index (a key metric of ENSO) over the last 850 years (part 1, part 2). Yes, you’re not dreaming, it did take 5 years, for reasons I don’t want to get into. One reason is that compiling paleoclimate data by hand is one of the most thankless tasks known to science, and the state of cyberinfrastructure at the time made this especially unproductive. That’s what got me motivated to change this. Another reason is that I had to teach myself some serious statistics, which took a while. Finally, I had to learn to make do with imperfect results, which was probably the hardest part. (To this day, I am still extremely dissatisfied with these reconstructions, which is why I am so keen on Feng‘s newest work using paleoclimate data assimilation to update these estimates. The years have made me marginally wiser, though: I have ceased to expect that this will be perfect. )

Back to Kim’s project: part of the grant was to use new data from Palmyra to fill in the holes of the record shown above. Kim’s lab delivered some exquisitely high-resolution data, which provide new ways to probe the past behavior of ENSO.

Volcanoes and ENSO

Once we had such a reconstruction in hand, it was natural to look for relationships with external forcing. Indeed, the extent to which changes in Earth’s energy budget (resulting from changes in the Sun’s luminosity, in volcanic aerosols obscuring the Sun, or from human emissions of greenhouse gases) may affect ENSO has been a longstanding question in the field.

On the volcano side, the story goes back to 1984, when Paul Handler reported “possible associations” between volcanic aerosols and ENSO. At the time, very little was understood about ENSO, but it quickly became clear (partly through the work of Cane and Zebiak, mentioned above) that since ENSO could predicted up to 12 months ahead without any knowledge of stratospheric conditions, those could not be a major factor. Subsequent data did not appear to support Handler’s hypothesis, to put it mildly (e.g. Self et al 1997), but then again: there was so few volcanic eruptions over the short historical record that it could not answer that question conclusively one way or the other. Another issue is that Handler had proposed no plausible mechanism for the connection, which therefore looked like a fluke.

Yet, in 2003, Adams et al reported “Proxy evidence for an El Niño-like response to volcanic forcing“, using some of Mike Mann’s first multiproxy reconstructions of ENSO (the NINO3 index, to be precise) and a simple statistical methodology called Superposed Epoch Analysis (SEA). That was the impetus for his 2005 study cited above, which used the relatively recent thermostat mechanism to justify the El Niño-like response (counter-intuitive, because volcanoes cool climate, so why would they warm the tropical Pacific?).

In my 2008 study, cited above, I looked at this in more detail, using fairly large ensembles of simulations to look at how volcanoes can load the dice in favor of ENSO events; we concluded that their effect was negligible except for large eruptions, larger than the 1883 Krakatau eruption, which explained why one wouldn’t see an effct over the twentieth century, which was devoid of such large eruptions. Yet, all of this was largely theoretical until we could say with confidence what had happened to ENSO over the past millennium. Kim’s 2003 original record was a game-changer, but unfortunately did not sample some of the most interesting times for volcano fans: it did not cover Samalas, Kuwae, or the early 19th century eruptions, for instance.

So I was really keen on testing this in my new reconstructions. However, I was also clear-eyed about dating accuracy. In the Earth Sciences, dating precision is always key. I knew our 2013 reconstructions had at precise enough of a temporal precision to explore solar connections and decadal and longer scales (which we did), but I was skeptical that we could meaningfully evaluate the volcanic response, where being off by even one year could really screw things up. There was evidence of misalignment in some series, which could throw the whole game off.

That did not prevent Mc Gregor et al (2010) from repeating the analysis of Adams et al (2003) on their “Unified ENSO Proxy” (a haphazard assemblage of existing ENSO reconstructions, some using the same underlying data). I was not convinced it was correct, and unconvinced that even my own reconstructions were good enough for that.

New splice on the block

Enter Sylvia Dee, who joined my lab in 2010. As part of a project for my Data Analysis class, I encouraged her to look at connections between volcanic forcing and the latest and greatest Palmyra data, pictured below:

Coral oxygen isotopes from Palmyra island. Shown are monthly resolved fossil coral oxygen isotopes measured in the newest multisegment Palmyra corals. See Dee et al, 2020, for details.This version of their Fig 1 showcases the absolute (U/Th) dates used to constrain the events’ timing.

We did not find much at the time, but there were a few snags: (1) the dating was provisional, and Kim would later revise it; (2) the forcing wasn’t that good (we saw that in part 1), and (3) there also weren’t many climate simulations to compare this with. What a difference a decade makes! In the intervening years, Kim refined the chronology, Sigl et al came up with vastly improved estimates of the forcing (2015; see part 1), and the PMIP3 past1000 simulations (2013) provided a trove of model results to compare to.

A couple of years ago, Sylvia (then a postdoc at Brown University,) decided to dust off this old code and apply it to this new trove of data using a more thorough detection algorithm. Together with Kim Cobb, Toby Ault, Chris Charles, Hai Cheng, Larry Edwards, and yours truly, she was able to test the link between volcanism and ENSO with unprecedented accuracy.

The results are presented in this article, published today in Science. What we found was that this dataset — the longest, best replicated, highest-resolution, and most proximal record to the center of ENSO variability currently available — reveals no consistent relationship between explosive volcanism and ENSO. This stands in sharp contrast with what some climate models are currently saying: see the colored curves on the figure below.

Response to explosive volcanism in Palmyra coral d18O data and PMIP3 model simulations. Source: Dee et al, 2020

Implications

In the years since the Adams et al (2003) study, the El Niño-like response to volcanism has become somehow enshrined in the paleoclimate cannon. It is not entirely obvious why that happened, and I think that deserves a commentary. When I first started presenting the results of my 2008 paper, many climate scientists were looking at me like I had two heads (or, perhaps, none at all). One of the common responses I got from modelers was (paraphrasing) “my GCM doesn’t do that, so it can’t possibly be true”. Then, some models (GFDL’s CM2.1 for instance) started producing the El Niño-like response in the year following an eruption; sometimes, one could even show that the thermostat mechanism invoked by Mann et al (2005) was at play in those GCMs.

Then, one day (I forgot exactly when), the mighty Community Earth System Model started producing this behavior. The IPSL model also started doing it, though for completely different reasons. And now, this El Niño-like response to volcanism seems accepted as a fundamental law of Nature by some modelers.

This came in sharp relief last summer, while I was co-writing a chapter on paleoclimate evidence for changes in ENSO in an upcoming AGU book, with Kim Cobb, Julia Cole, and Mary Elliot. We concluded that there was no robust influence of strong volcanic eruptions on ENSO, but a chapter dedicated to precisely that question (and, it is noteworthy, written exclusively by modelers), came on the other side of that question. How can the same book conclude two different things?

I think I know the source of this confusion: the vast majority of the reconstructions reviewed in that chapter used tree-ring records. While those are reported to have annual precision, analyses such as SEA require extremely accurate dating, and it is known that multiproxy reconstructions are vulnerable to even minute dating uncertainties [Comboul et al., 2014]. To wit, Sigl et al. [2015] showed that even cross-dated tree-ring chronologies, often considered the gold standard of chronological accuracy in the paleo realm, were offset by 1-2 years in the case of some eruptions. Such offsets get compounded in a compositing  methodology such as SEA. A second reason is that SEA is rarely benchmarked against an appropriate null hypothesis [Haurwitz and Brier, 1981; Rao et al., 2019], if at all. A third reason is that many of the reconstructions involve extra-tropical tree-rings, whose primary ENSO imprint is through hydrological perturbations. Using simulations with the CESM model, Stevenson et al. [2016] showed that, to an extratropical tree (many of which have been used in ENSO reconstructions), nothing looks more like a volcanic eruption than an El Niño event. If this mechanism applies in nature, it would make such records rather problematic for disentangling the link between volcanism and ENSO.

In Sylvia’s latest opus, we took great care to address these 3 concerns:

  • the coral data come from overlapping cores, each with several high-precision dates. That leaves almost no wiggle-room for age uncertainties, a point made at length in the paper’s supplement.
  • we use a rigorous block bootstrap test to determine the significance of the excursions, against a null distribution obtained by resampling ENSO states in non-volcanic years (again, see the supplement. That’s where all the actual science lives).
  • we use data from the heart of the tropical Pacific, which responds directly to sea-surface temperature, not its distant atmospheric teleconnections.

Is this the last word on the topic? Of course not; nothing ever is. But I think we can say with confidence that it will stimulate more research. I am eagerly awaiting conversations with modelers telling me that these observations must be wrong because they contradict their model, and (once they’ve reluctantly assimilated the information), papers that claim that the models were simulating this all along. To their credit, apart from CESM, none of the PMIP3 models seem to show a consistent ENSO response to volcanism. Perhaps they are on the right track? As in part 1, I am curious what PMIP4 models will show about this.

But until a new record comes along, better replicated, dated and proximal to ENSO state than this one, the burden of proof will fall on the shoulders of those who assert a link between volcanism and ENSO.


Volcanism & climate, part 1

26 03 2020

Volcanoes are among the most iconic of Earth’s structures, active portals conveying the Hadean depths to the heavens, and all the ecosystems in between.  When the topic of volcanoes comes up, most people think of Kilauea’s lavas flows, Eyjafjallajökull’s ash cloud grounding air traffic, or lovers caught in a last embrace at Pompeii.  Volcanoes turn out to also be an important forcing of Earth’s climate, and not just because they spew greenhouse gases (at this point, they release carbon dioxide 100 times slower  that our civilization). The most recent, climatically significant eruption was that of Mount Pinatubo in 1991, immortalized in this picture. 

The driver of a pick-up truck desperately tries to overrun a cloud of ash spewing from the volcanic eruption of Mt. Pinatubo in 1991. Credit: ALBERTO GARCIA

Read more: https://globalnation.inquirer.net/100047/filipinos-pinatubo-photo-named-among-greatest-of-all-time#ixzz6GzFFGzsK 

Terrifying though that moving mountain of ash and burning gas may be, it does not, in fact, have much effect on climate: that ash is short-lived and shallow,  easily scavenged out of the lower atmosphere by rain. What does matter for climate are the sulfur emissions (specifically, SO2), which coagulate into fine droplets that are rather effective at reflecting sunlight.  Explosive eruptions produce buoyant plumes that can catapult such reflectors into the stratosphere (the region of the atmosphere just over the cruising altitude of commercial jetliners), where they are isolated from the stormy turmoil of the troposphere (the lower layer that we breathe).  In the stable heights of the stratosphere, volcanic aerosols persist for several years, during which they have ample time to circumnavigate a good chunk of the globe, thanks to the stratosphere’s vigorous circulation.  The typical climate impacts begin shortly after an eruption, usually peaking within a year, with a gradual return to “normal” (if there is such a thing for a chaotic system like Earth’s climate) within 5 years. 

At least, that’s the picture painted from the painfully short instrumental record, which has seen only a handful of climatically-significant eruptions — Pinatubo and El Chichon (1982) being the only ones that were recorded by satellites.  For this reason, the way stratospheric aerosol forcing is implemented in climate models mimics what happened during Pinatubo, because that’s the largest one we have observed with any global coverage.

However, we also have ample geologic and documentary evidence for much larger eruptions prior to that: for instance, the “year without a summer” due to the Tambora eruption of 1816, or the Samalas eruption of 1257, the largest of the Common Era, and probably the third largest of the last 10,000 years, according to ice cores. Yes, what falls out of the stratosphere eventually falls to ice caps, where they can recorded within the annual layers of fast-accumulating ice deposits.  (for more on how we reconstruct volcanic forcing from ice cores, see this article). So paleoclimatologists, volcanologists, archeologists, geographers, historians and climate modelers have long been interested in how volcanoes influence climate and society.

Another reason study the climate response to volcanic aerosols: they serve as our best analog for a form of geoengineering called “solar radiation management”, which is — to the immense dismay of reasonable people — now considered as a viable policy proposal to mitigate the worst impacts of climate change (while creating a host of gruesome side effects that such proposals tend to ignore). 

All of this to say that volcanoes offer incredible natural experiments with which to probe Earth’s climate system, and how it is represented by climate models (the computer codes used to project climate’s evolution over the next century, for instance). The last assessment report of the Intergovernmental Panel on Climate Change (IPCC), in particular, summarized the peer-reviewed literature as of 2013, and highlighted the conundrum illustrated here: 

Fig 1: Superposed epoch analysis (SEA) on simulated and reconstructed temperature response to the 12 strongest volcanic eruptions since 1400 AD, reproduced from IPCC AR5 (Masson- Delmotte et al., 2013) Fig. 5.8b

The figure shows that, on average, climate model simulations of northern hemisphere temperature tended to produce a response to volcanic cooling that was stronger, peaked earlier, and recovered more rapidly, than temperature reconstructed from paleoclimate indicators (tree-rings, corals, ice cores, sediment cores, etc). On the face of it, such a discrepancy could call into question the fidelity of climate simulations, the accuracy of paleoclimate reconstructions, the quality of the forcing, and perhaps all three. Like many IPCC figures, it has stimulated many of us to think deeply about what is going on.

In 2017, my group was lucky enough to receive funding from the National Oceanographic and Atmospheric Administration to study this and other climate impacts of volcanic eruptions through the new prism of paleoclimate data assimilation, particularly the Last Millennium Reanalysis. One of the goals of the project is to understand (and hopefully correct) the discrepancy shown above. After some very careful work (and a lot of Python code), USC graduate student Feng Zhu reports in a recent paper (soon to be published in Geophysical Research Letters) that the discrepancies can indeed be reconciled, with a few asterisks.

At the risk of spoiling the suspense, here’s the same picture, after accounting for known effects due to (1) the location of paleoclimate records (mostly, trees); (2) the seasonality of these proxies (extratropical trees only grow during the summer), and (3) focusing on the observations types that are least affected by a process called biological memory (maximum latewood density, or MXD).

Fig 2: (a) Same as Fig 1, but applying the LMR after resolving differences in the model and proxy domains associated with seasonality, spatial distribution, and biological memory. (b) Same as (a) but using the NTREND network of MXD records (Wilson et al, 2016; Anchukaitis et al, 2017)

This figure shows that, for well-characterized eruptions and a careful, like-to-like comparison of climate models and MXD records, the discrepancy is resolved to a shocking extent. Remarkably, this holds true for two very different sets of paleoclimate observations, a handpicked selection like NTREND, or a more permissive selection like PAGES 2k. For details, the reader is invited to read the paper (in press at Geophysical Research Letters).

Now, before you take this to the bank, there are a few asterisks. The first thing to mention is that we are not the first to point out that these effects matter; indeed our study was motivated by decades of research by many careful scientists. Standing on the shoulders of giants, as always. Our main contribution is to weave all these factors together to enable a systematic comparison of models and reconstructions over multiple eruptions. Yet a big caveat is that the comparison could only be done on 6 eruptions, highlighted in this figure:

Fig 3: Comparison between the volcanic forcing of Gao et al., 2008 (used in many PMIP3 models , as well as the iCESM simulation of Stevenson et al., 2019; Brady et al., 2019) and the eVolv2k version 3 Volcanic Stratospheric Sulfur Injection (VSSI) compilation (Toohey & Sigl, 2017). The triangles denote the selected 6 large events between 1400 and 1850 CE. 

While the promise of paleoclimatology is to sample many more and larger events than captured over the instrumental record, we found our sample still limited, for three reasons:

  1. Forcing uncertainties: many of the model simulations used the Gao et al 2008 forcing, which has now been considerably refined by the incredibly careful work of Michael Sigl and co-authors. As a result, many of the eruptions were just not comparable, or we had to manually adjust the timing of eruptions to really compare like to like. The comparison should be much richer when PMIP4 simulations, which use the evolv2k dataset, come online.
  2. Data coverage: the “pull of the recent” is as real in paleoclimatology as it is in paleobiology. What this means is that the most recent eruptions are the one that are best captured by our proxy network; the old ones, not so much. This remains a problem for the 1257 (Samalas) and 1450’s (Kuwae + others?) eruptions, as we discuss at length in the paper. We therefore had to focus on the last 4 centuries — not the full Common Era as we were hoping for.
  3. Cluster effects: some eruptions tend to happen in clusters, making it hard to separate their effects. To keep the comparison clean, Feng chose to focus on isolated eruptions, which further reduces the number of eruptions.

So while our careful analysis of the data enables a spectacular resolution of discrepancies between models and reconstructions, that is only the case for this small set of 6 eruptions. Therefore, our conclusion (that the physics of the climate models is not the main culprit here ; only the way the comparison was previously done) presently applies only to these 6 eruptions. At least, for now: there is obviously a large potential for expanding the set of eruptions for this comparison in PMIP4, and as more MXD chronologies are incorporated in data syntheses like PAGES 2k or N-TREND.

One of the more interesting questions is whether our conclusion would hold true for much larger eruption like Samalas, mentioned earlier. As pointed out before, models and reconstructions disagree fiercely on that one. In 2015, Markus Stofffel and his group did some exciting work showing that you could reduce much of the difference by looking at carefully screened long MXD chronologies, considering seasonality (as we did) and improving how stratospheric sulfur aerosols are represented in models. These “self-limiting” feedbacks have long been known to become important for very high sulfate loading, yet a lot of climate models did not incorporate them. Using the IPSL model with a particular formulation of this feedback, Stoffel et al concluded that the improved stratospheric physics was key to bringing models and reconstructions in line. Does this contradict our result?

We don’t know yet. It remains to be seen how their comparison would work for a broader set of models and observations. The good news is that Feng made all his open-source (Python) code freely available to reproduce and extend the results of the paper. I, for one, would love to have more simulations to play with, incorporating such improved physics and seeing whether the reconstructions can help discriminate between competing parameterizations. If you have ideas for how you’d like to extend this study, please reach out! This type of work lends itself well to long quarantines.


Reflections on a pandemic, part 2

25 03 2020

a radial survey of topics on my mind in the midst of the COVID-19 pandemic, continued from Part 1.

Risk Perceptions

I’ve come to appreciate that most of our fights are fundamentally about risk perceptions, even when they are couched in different words: are we better off with strong social safety net or a strong military? Can we balance environmental health and economic growth? (that’s a false choice, but one that is still repeatedly offered.) Can society allow gay couples to marry without threatening the institution of marriage? (again a false choice, but a common argument). Where you land on these questions depends on how you weight the risk of one action or inaction vs the other.

COVID-19 has been an interesting mirror to calibrate how (ir)rational we are in our perceptions of risk. Certainly the death toll in places like Italy (nearly 10%, according to these data) is extremely worrisome. Yet, it needs to be put in the context of other morbidity factors (see table below for USC data): it’s not like heart disease went on confinement during the COVID-19 pandemic. In fact, given that it’s now much more difficult to exercise and that (in my observation) junk food was the first to be snatched from supermarket shelves, I would imagine that deaths from heart disease will only get amplified by COVID-19, though we may not see that right away.

Leading cause of death in the United States in 2017. Source: https://www.cdc.gov/nchs/data/nvsr/nvsr68/nvsr68_06-508.pdf

Missing from a lot of these tables is also the breakdown by age or the existence of pre-existing health conditions. So how is one to make a rational assessment about the right level of concern? Amidst all these extremes, I was glad to hear the level-headed appraisal of Amesh Adalja, which I heartily recommend.

This made me think more broadly about why COVID-19 is eliciting a panic response for much of the world, whereas climate change (arguably, an even more formidable threat) has failed to do so. Much has been written on this, including this excellent piece co-written by my colleague Eric Galbraith.

The timescales are critical here: our ability to perceive risk is the result of our evolution, which has rewarded the ability to avoid or thwart immediate, tangible threats like this coronavirus, but has yet to select us on whether we correctly assess long-term threats like climate change. To paraphrase the terminology of Daniel Kahneman , our instinctive “System 1” is peculiarly bad at assessing abstract, long-term threat, which it discounts entirely in favor of more immediate concerns (however mundane). System 2 involves careful thinking, and our society has evolved that in the form of scientific institutions and (in some countries, anyway) governments that actually listen to those scientists. What should be clear from the work of many cognitive psychologists, beginning with Kahneman and Tversky, is that we are not nearly as smart as we think we are, and that we should place our trust in the hands of experts. Experts are fallible too, but, as Naomi Oreskes reminds us, the thought collective they form, and its process of critical interrogation, guarantees that their message gets ever closer to the truth.

That is why I listen to epidemiologists when it comes to COVID-19, and that is why everyone should listen to the quasi-absolute consensus on man-made climate change.

The lesson so far is that we seem to be quite bad at learning our lesson: only when smacked in the face with consequences do most of us finally overcome our reluctance to enacting the recommendations of experts. Inaction on COVID-19 should not be surprising: even when our own health is clearly at stake, many of us procrastinate about the advice given by our primary care physician until a strong warning sign comes, usually in the form of illness. It would be wise to view COVID-19 as a glaring illustration of the current inability of our society to take prompt and necessary action on crises even when we have seen them coming for a while. As should be clear, we can’t afford to procrastinate on major crises any longer, so perhaps we should take that subtle cue to re-assess our societal priorities, and start by engineering economic system that serve the planet and its people, not the other way around.

COVID and Climate

COVID-19 is forcing some societal changes that many people once argued were impossible: “the American way of life is not up for negotiation. Period”, G.H.W. Bush once said. One submicron-size viral pandemic later, that way of life got upended pretty quickly, without the need for any negotiation.

To me this is a vibrant demonstration of how fundamentally changeable our society is. For decades now, climate scientists like myself have rung the alarm bells about the devastating costs of unmitigated carbon levels in the atmosphere, requiring nothing short of a war-time mobilization effort to rewire our economies in carbon-neutral ways. For the most part, the body politic chose to do nothing, for many reasons. One argument you often hear, is that it would be too difficult to re-organize our society to meet that challenge. Clearly it is not. In fact, as Western societies rethink how to generate income from the comfort of their own home, we are seeing the potential for what a radically more local existence could mean.

On one level, COVID-19 is forcing us to enact many of the same changes that a low-carbon life would require. But the parallel goes deeper: as this brilliant visualization makes clear, there are two major reasons COVID-19 is so disruptive to our way of life and our economy:

  1. We’re late to the fight. In an exponential game, the early bird catches the worm. If drastic international travel restrictions had been enacted as soon as the virus was detected in, well, 2019, much of the world wouldn’t be in confinement right now, and this economic crisis could have been minimized. We are now witnessing the true cost of procrastination.
  2. We’re not working together: there could have been a whole lot more international cooperation to stem this crisis. Despite calls by the WHO, there was not. Be that as it may, there are a lot of things local governance can do here, at the level of countries, states, and cities. But within these entities, we all need to play along. Social responsibility is following the advice of public health experts and officials; supporting each other through these tough times; at the very least, not falling into a narrative of scarcity that leads some to stockpile toilet or other necessities that leaves others in the cold. We’re all in this together, and if too many people buck the trend, there might as well be no measures in place. Unfortunately, the Faux News demographic is not helping here.

In policy parlance, this is called a “collective action problem“, of which climate change is the poster child: there is a cost to action, which no one wants to incur unless everybody does. Even though there is a much, MUCH higher cost to inaction, it is well-known in game theory that this asymmetry can result in paralysis. COVID-19 and climate change both show that unless all of us are aware of the risk and committed to addressing it, the needle won’t move, or move too little too late. COVID-19 will help us see this one way or the other: it has already shown the willingness of some societies to drastically reshape themselves to protect their most vulnerable members. In ours, it will either show collaboration to be a success, or it will show the lack of collaboration to be a terrible failure. Either way, we should heed the lesson.

That is, if we see things for what they are. In the Age of Misinformation, that is far from a guarantee. Here again, COVID-1, climate change, and other societal risks share a common enemy: science denialism.

Denialism

David Michaels makes the apt point that the US dilly-dallying on this crisis shares many of the epistemic roots that have plagued the accurate appraisal of climate risk. Namely, that when science (any science) is seen as threatening to an economic system, no amount of corporate malfeasance will be spared to undermine that science. This was abundantly shown in Merchants of Doubt. Because science denialism has been perfected by many industries (starting with the astonishing PR innovations of the tobacco industry) it is a well-oiled machine that extends its tendrils to the heart of right-wing media conglomerates, from Fox News to talk radio, who benefit from and amplify its message. And because their audiences have now been primed for decades to deny or minimize the warmings of experts, even educated Republicans in demographics at high risk of severe harm by COVID-19 continue to put their heads in the sand about the issue.

This is no accident. This is the result of a decades-long war on science that has pitted every scientific issues that conflicts with the bottom-line of entrenched industries against the momentous disinformation apparatus of modern right-wing media, from Fox News to Breitbart. If I were a social Darwinist, I’d say that we should let those who refuse to hear the evidence die of the consequences of this refusal. Unfortunately, we’re all crewmates on Spaceship Earth: my actions affect them, and their actions (or lack thereof) affect all of us. So there is no choice but for everyone to get on board and accept the evidence, preferably before it is too late.

Beyond COVID-19, the concerning pandemic here is the denial of reality, exemplified by Trump’s wishful thinking about the issue. My only hope is that this crisis underlies the true costs of denying reality, and rehabilitates critical thinking at all levels of our society. For that to happen, the tech giants that profit from the spread of misinformation need to change, and it seems to be leaving aside its supposed “neutrality” in the public interest. Great! Can we do the same for climate change, racial equality, vaccines, gun control, and other major societal issues, please?

Viral Conspiracies

For a brief time early in this millennium, “going viral” acquired a sheen synonymous with celebrity, fame and fortune (as well as, occasionally, disrepute, opprobrium, and ridicule). The SARS-CoV-2 virus abruptly reminded us of the its biological (and sometimes sinister) of viral.

The underlying mathematics are the same, however, and they may in large part be understood through graph theory. I first became acquainted with it through Duncan Watts’ “Six Degrees“, which lifted the curtain on the astonishing variety of natural and social phenomena that can be understood through graph theory (including paleoclimate reconstructions, if you can believe it).

I empathize with the many people throughout the world who feel abandoned by such institutions as crises multiply around them. While it is not the only problem, I do think that scientists being too distant from the public they serve is one reason why we see such conspiracy theories multiply (Russian trolls being another, non-negligible one). This blog is one attempt at communicating science a bit more directly than through the stilted prism of peer-reviewed technical journals.

There is a perilous parallel in how similarly infections and misinformation spread, and the small world property has a lot to do with that. Of particular interest to me today are conspiracy theories, like “climate scientists are only in it for the money” — no doubt referring to those fat suitcases full of unmarked $100 bills that the money-hungry solar industry regularly hands me, which is why I am currently sitting in a fortress in the middle of the ocean from which I pull strings with a cat on my lap. There are many other examples of such conspiratorial ideation, from the myth that the 1969 moon landing was a hoax, to anti-vaccine paranoia, to the idea that a cure for cancer is being withheld by vested interests, to Flat Earthers contending that NASA has been brainwashing us that the Earth is round when in fact it is flat. Common to many (all?) of these conspiracy theories is a strong disillusion in institutions, not only government but also scientific bodies.

In a refreshingly clear and concise article, David Robert Grimes proposed a simple mathematical model to quantify the limited viability of conspiratorial beliefs; it’s basically viral contagion in reverse. Imagine that you are part of a conspiracy trying to rule the world, and (naturally) you don’t want people to find out. Despite your best efforts to keep it a tight-lipped secret, information always gets out, sooner or later: you might be talking in your sleep, blurting out secrets to your spouse without even knowing; or there might be a whistleblower in your organization, worried about your plot to take over the world for solar panels. Either way, your network of conspirators is leaky, and sooner or later someone is going to call The Guardian with some damning revelations.

I’m going to skip over the math (looks like Grimes had gone a little fast himself, and that some aspects needed a correction), but one way to look at this is to ask: even in the best of circumstances, for how long can a global conspiracy endure before someone spills the beans, voluntarily or not? The answer depends obviously on how many people are “in on it”, how carefully they communicate, etc. To give just one of the example (one that hits close to home), here is the probability of spilling the beans on that climate change conspiracy as a function of time:

Failure curves for the climate change “hoax”: The blue solid line depicts failure probability with time if all scientific bodies endorsing the scientific consensus are involved, the red-dotted line presents the curve if solely active climate researchers were involved

Assuming a fixed probability of an intrinsic leak (i.e. how likely is each conspirator to spill the beans?), the main variable is the number of conspirators. With just those evil, blood-thirsty climate scientists doing the conspiring (about 30,000 of us, by Grimes’ estimate), it would take about 27 years for the climate “hoax” to have a 95% probability of being exposed (red dashed curve). Add to that the entirety of NASA, the American Geophysical Union, and other gatherings of shape-shifting vampires (about 400,000 total), and you get the blue curve, reaching the same 95% probability in just 4 years. In other words, if man-made global warming truly were a hoax, the beans would very likely have been spilled many times over.

You can argue about the exact numbers picked by Grimes for the probability of an intrinsic leak, but there is no going around the fact that keeping secrets between large numbers of people is tough business. That’s why Dr Evil only works with a select cadre of co-conspirators, not 400,000 of them. Also, he kills a sizable fraction of them when Mr Bigglesworth gets upset, which keeps the numbers low. Grimes’ article is considerably more interesting, though it involves fewer murderous cats. It is well worth a read.

May it become one more argument against the ludicrous theories peddled by science denialists of all stripes.

Virus as Medicine

While SARS-CoV-2 was not my idea of a good time, it has changed our life practically overnight, and is forcing a fundamental rethinking of pretty much every aspect of modern existence, from travel, work and schooling to artistic and political expression. Politico ran a nice piece over the week-end, with over 30 thinkers sharing their view of how COVID-19 was reshaping our world, in many cases, I’d argue, for the better. But no one said it quite as beautifully as Lynn Ungar:

Pandemic by Lynn Ungar

What if you thought of it
as the Jews consider the Sabbath—
the most sacred of times?
Cease from travel.
Cease from buying and selling.
Give up, just for now,
on trying to make the world
different than it is.
Sing. Pray. Touch only those
to whom you commit your life.
Center down.

And when your body has become still,
reach out with your heart.
Know that we are connected
in ways that are terrifying and beautiful.
(You could hardly deny it now.)
Know that our lives
are in one another’s hands.
(Surely, that has come clear.)
Do not reach out your hands.
Reach out your heart.
Reach out your words.
Reach out all the tendrils
of compassion that move, invisibly,
where we cannot touch.

Promise this world your love—
for better or for worse,
in sickness and in health,
so long as we all shall live.


Reflections on a pandemic, part 1

17 03 2020

Oh, you thought coming to this blog would spare you from more coverage of the COVID-19 pandemic? Think again. As a scientist, writer, and all around human, it’s impossible not to observe and reflect on this defining moment, affecting everyone on this planet to varying degrees. How often do such black swans recur? We still speak of the Black Death, 7 centuries later. Though  advances in the social and life sciences should ensure that the mortality rate is lesser for COVID-19, I am fairly certain that we will still be talking about this in 7 centuries (perhaps, in another civilization evolved from our own). 

The sole purpose of this post series is to offer some personal reflections on the topic. It is not meant as a public service announcement — see your local authorities and epidemiologists for that.  It is not meant to be alarming, reassuring, or anything in between. It is just meant to offer what I hope to be a different perspective from what you have read everywhere else. Mostly, it’s a form of therapy for me in putting on paper the various swirling strands of thought going through my mind. I doubt any of you have time to read, but right now, I have time to write (hello, Spring Break staycation!), so here goes.

Connectedness

The first point that strikes me is what many writers and filmmakers have pondered for a while: in an increasingly interconnected world, there is no such thing as a local problem anymore (“Twelve Monkeys” comes to mind). Many, particularly in the US, have this idea that they can barricade themselves behind their wealth and ignore problems half a world away. 

Not anymore. We live in such an interdependent world that there is almost no way to contain major crises. This is a point I have appreciated since the Syrian crisis (incidentally, a crisis heavily influenced by climate change) brought terrorism to the heart of Paris or Orlando. It’s no longer good enough to have a sea between you and a crisis — terrorism has abolished that distance. 

As we see now with COVID-19, a virus that is sufficiently contagious (and in this case, sufficiently deadly) can shut the world off more efficiently than a war.  Indeed, I have lived in the US since 2001. The country has been at war on multiple fronts every day since September 11 of that year, but there has been virtually nothing in my daily existence to attest to that fact. This virus, on the other hand, is forcing a complete re-arrangement of society, with social distancing being the norm in most places for the foreseeable future. How long-lasting will these impacts be? Will we ever return to a sense of normalcy about the large gatherings where some much cross-pollination happens, like music and arts festivals drawing tens of thousands of people? What about spiritual gatherings of tens of millions of people?  A lot depends on how this virus evolves, and on what kind of defenses we evolve against it (particularly, an affordable vaccine).

Vaccination

 I teach a general education class called “Lies, damn lies and statistics”, where I take the students through case studies in misinformation and teach them epistemic and statistical immune boosters to make them resilient to the spread of fake news of various ilks. One of those case studies, arguably the most spectacular, concerns the modern anti-vaccination movement in western countries, threatening to negate nearly 2 centuries of progress in medicine. For a great recount of it, see this story.  (actually, this is a public service announcement: vaccines work. vaccinate your kids). The really interesting part to me is why, despite all these anti-vaxxer myths having been repeatedly debunked, they still seduce so many people, including some in my friend community. This is where cognitive biases come in ; here is a thorough (and slightly hyperventilating) account of the relevant cognitive psychology in the context of vaccine rejection. The main point is this: vaccines have been a victim of their own success. Having nearly eradicated most childhood infectious diseases in the western world, you can find people (mostly on the Whole Foods parking lot) who now dread minuscule doses of a naturally-occurring compounds like formaldehyde more than they dread measles, mumps, rubella, or small pox. Why? Because they’ve never seen any cases of these deadly diseases, but they have seen the damages of additives that the food industry is still, somehow, authorized to sell. (see Pink Slime, for but one example). So they prefer not taking action to fend off a immense risk than taking action with a minuscule or non-existent risk. That’s the negativity bias in action. 

My hope is twofold: (1) that an efficacious, affordable vaccine against COVID-19 is found ASAP (we’re looking at 12-18 months in the best of cases, unless a miracle happens); and (2) that this vaccine radically changes the conversation about all vaccinations. I hope we will see a lot of parents who refused to vaccinate their children suddenly rush to get their at-risk parents (and themselves) vaccinated. If this crisis doesn’t change attitudes, I don’t know what could. And if we don’t learn from this crisis, then we are really, REALLY screwed. 

Understanding and Predictions

On the topic of “science works, yo”, the COVID-19 mayhem is a reminder of just how predictable this whole thing was, and how complacent nearly everyone in the western world has been in the face of such predictions. Bill Gates’ 2015 TED talk “The next outbreak? We’re not ready”, where he echoes a lot of the bells that epidemiologists have been ringing for some time, is justifiably enjoying a rebirth on YouTube. Or this hypothetical scenario eerily similar to COVID-19 explored only last year by security experts. Even as the epidemic was spreading exponentially in China, the western world did precious little to prepare (more on this below). To me this is a reminder that yes, science works, and that expert predictions are not entirely garbage (see also: climate projections). All the modern technology we use every single day is built on that expert knowledge, so maybe, you know, trust your experts? Don’t blindly trust technology, however: right now there is no techno-fix that can substitute for the behavioral changes that experts say are necessary (and proven to work, not just in past  epidemics, but in this one as well — see China).  

On this note, I repost below a fascinating graph contrasting the spread of the epidemic in Italy and China (Hubei province). The black curve shows the expected growth, which follows an exponential form. The blue and red curves shows the number of cases in Italy and Hubei Province, China, which have comparable populations. The Hubei data have been time-shifted by 36 days to put them on equal footing as the Italian data, since the outbreak started commensurably later there. 

Hubei/Italy comparison (origin unknown – please help me trace it)

In the early days of the outbreak, both curves were smack on top of the exponential one. After implementing lockdown measures, however,  Hubei residents kicked themselves off of that deadly curve, and its infection rates slowed markedly. The infection seems on track to peak soon, and (barring another exogenous flare-up) decline thereafter.  Now, the growth rate varies a bit from country to country (see recent data here), but again, those of Italy and China (as a whole, this time), appear to have been relatively similar in the early stages. It’s too early to tell if and how soon Italy’s lockdown will having similar benefits as China’s, but it shows how crucial it is to act early and aggressively. 

More recent data compiled by Johns Hopkins and visualized by the financial times also illustrate this well:

You might notice that the y-axis is logarithmic on the plot above. In such a coordinate system, an exponential growth looks like a straight line, which is what you see for most countries that have yet to enact measures. Now let’s geek out on the math for a second: why does this simple mathematical form fits the data so well? In other words, what makes N = N_o e^{rt} 
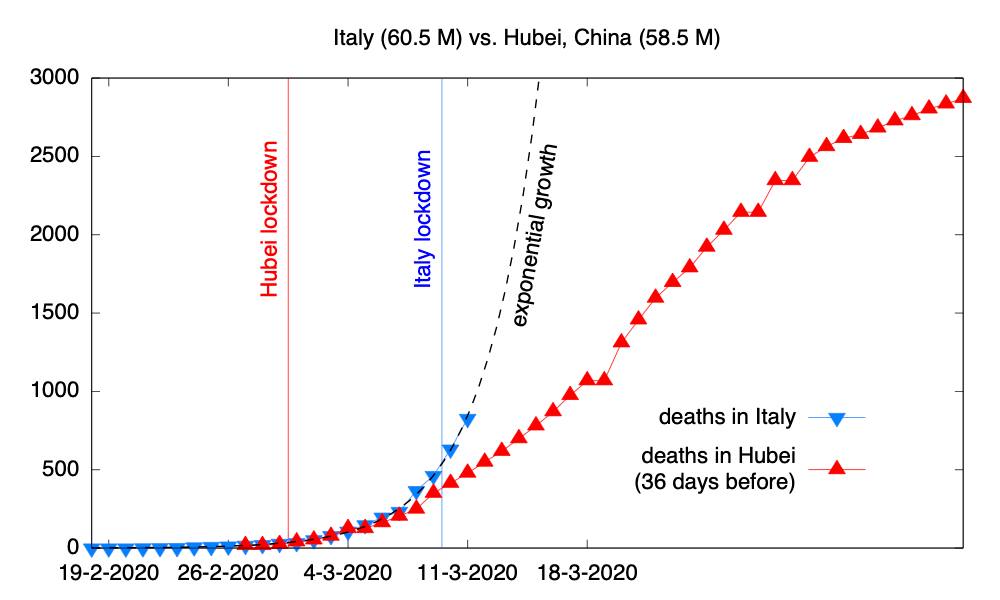
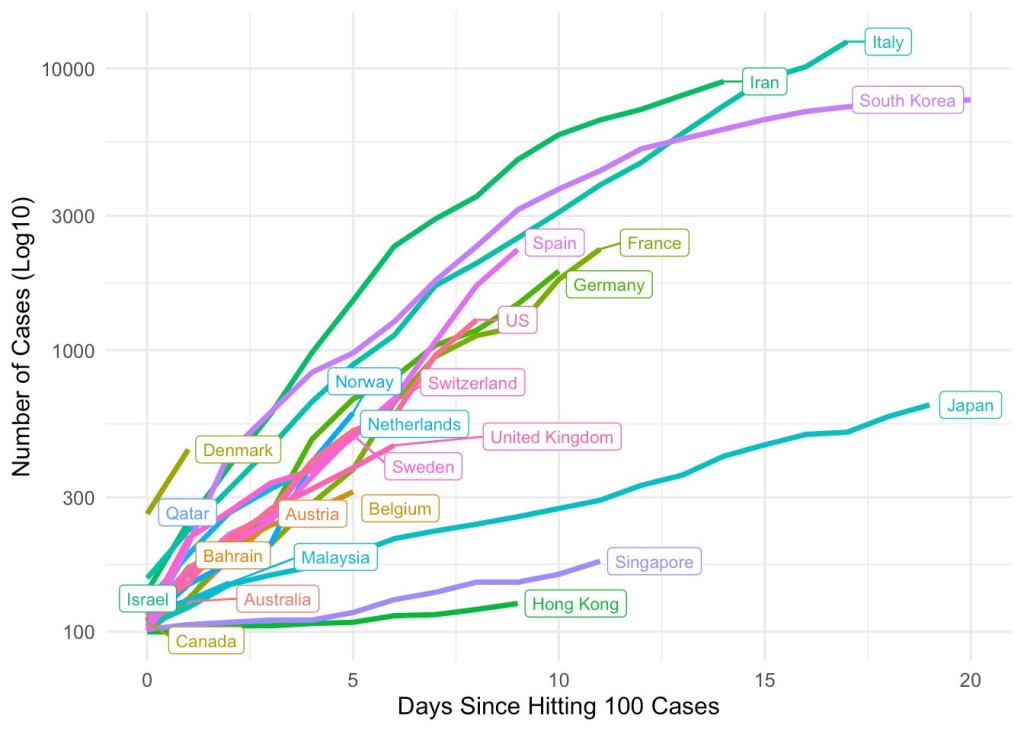
such a good model for (early) disease propagation? (N is the number of cases, t  is time in days, and r is the growth rate, in # of new cases per day.)

An exponential it is the solution to the differential equation:

\displaystyle \frac{\mathrm{d}N}{\mathrm{d}t} = ry

which says (in English) : the more people are infected, the faster the infection spreads. Simple as that. The simple reality of rates of change being proportional to the amount of something is the reason exponentials are so ubiquitous in nature. (things get more complicated as other factors enter the fray, but by all accounts COVID-19 is still in a regime of exponential growth for most countries, certainly the US as of this writing).  There are, however,  notable exceptions, like Singapore, Hong Kong and Japan. What’s different there? The difference is that they have centralized governments that dealt with contagions like SARS quite recently. They were vigilant, prepared, and quick to implement measures to contain and mitigate the outbreak.  Maybe government ain’t all bad? (see below)

Another remark about growth rate (r) is that, unlike the death rate, it does not  discriminate on the basis of age or pre-existing respiratory conditions, explaining why we see the infection spread at similar rates in many countries, even with fairly different social structures.  But existing data already makes a strong case that aggressive action to cut the transmission rate can and does work.

Regardless of country or creed, when epidemiologists tell you to take this seriously, please do: we (collectively) have seen epidemics before (see, SARS, MERS, the 1918 flu), we can model and predict them reasonably well, and there are many proven measures to mitigate the outbreak. Those work, as we can see that in near real time. Of course, those measures are only effective if (1) there is an effective government in place; (2) people actually listen to public guidelines.  If the government fails to grasp the urgency of the crisis, the country/province wastes precious time, and we pay that dilly-dallying with the price of blood. And if people fail to listen to follow the guidelines of their public health officials, things are nearly as bad.

This is brought home by this chart by Tomas Pueyo, which shows the impact of wasting just ONE day in implementing social distancing measures to curtail the spread of a similar epidemic. Obviously, while the death tolls depends on the true death rate of the virus (still unknown, but most likely in the range of 1-2%) and the age pyramid (since it disproportionately affects the elderly), it is trivially obvious that the fewer people infected, the better.

source: Thomas Pueyo

Here’s a thing about exponentials: they start out very flat, and quickly reach astronomical levels. The classic example of such geometric progressions is the legend of Radha playing chess with Krishna in disguise. At current rates, and *if we do nothing* (which we’re not, thankfully), there could be 100 million cases by May in the US.   Clearly, social distancing is necessary to flatten that curve. Not tomorrow, yesterday.

Government

I live in the United States, where the Trump administration has miserably failed to take adequate measures to this crisis. That too, was entirely predictable: they’ve failed to take adequate measures to pretty much any threat they have been faced with so far. Why? Because, like much of the GOP, they do not believe in government. As often pointed out*, one’s attitudes to government are a self-fulfilling prophecy: if you believe government sucks and vote for a party that repeatedly questions the very idea of government, you end up with a sucky, incompetent government. This utter incompetence on full display in this picture of Mike Pence’s coronavirus task force in prayer. You don’t need to pray, Mikey: all you had to do is heed the advice of your qualified scientists and public health officials. That is, if you believe in science, and if you don’t act like the lap dog to a delusional boss.

As someone who grew up in a country with a mostly functional government that people mostly trust (and on which they tend to excessively rely, arguably), I am always flabbergasted by the American mistrust of government, which is so deeply rooted in the country’s founding documents. Nonetheless,  it pays to remember that in the 20th century, Democratic and Republican administrations alike have embodied “big government”. They just happen to prioritize different parts of government, with Democrats believing in its ability to solve social problems, and Republicans believing it is ability to regulate what women do with their bodies, to decide what pseudoscience gets taught in schools, and to take from the poor to give to the rich. (Both have been more or less equally generous to the military-industrial complex, but I digress).

Whatever your views on economic policy, it would seem a no-brainer for every sane person to support a strong, responsive public health system. But to the twisted logic of the modern GOP, it is not: any kind of government service is seen as a slippery slope to Stalinism. Couple that with Trump’s maniacal tendency to dismantle any sensible work done by his predecessor, and you now have the makings of an entirely preventable public health crisis. 

If there is any silver lining about this, may it be this: once the dust settles and people have buried their dead, I pray that this crisis finally brings home to the American public that a strong, effective government staffed by competent, altruistic people is truly in their interest. Some observers even argue that this crisis is Trump’s undoing. Given about 42% of the American public seems to support him no matter what, I have my doubts about that. However, the problem isn’t this administration per se, it is a general hostility and ignorance about government, and I am praying harder than Pence that this crisis might change that attitude. It literally is a question of life or death. 

Evolution

Not that Pence believes in evolution either, but this pandemic is the living proof that yes, viruses are genetically labile, and their biological success depends on their ability to reproduce themselves. It’s evolution by natural selection in near-real time. If the coronavirus that’s now causing all this mayhem hadn’t evolved to be able to jump from bats to humans, we wouldn’t be in the middle of this pandemic (and: you wouldn’t have to get a different flu vaccine every year). Again, I very much doubt that this is the lesson people will retain from this crisis, but I put it here for the record: nothing in biology makes sense except in light of evolution

Surrender

I’ll end on a personal note for today. Right now in Los Angeles, COVID-19 is still a hypothetical threat for most. While we are taking prophylactic measures to make sure it stays that way, several things have hit all of us already: all the fun things are gone. No entertainment, no bars, no restaurants, no gym, no yoga studios (also: no toilet paper in any store, at least for now. Did people get the memo that this virus has nothing to do with dysentery?). Schools are closed. Most people who can are working from home. Most economic activity has come to a grinding halt, threatening the livelihood of people who were already living at the edge.

For me this is not all bad. I’m spending some quality time with my family; my wife has been cooking up a storm with all the fresh produce that panic buyers left on the shelves (more for us!). I am, perhaps for the first time, really getting to see what my daughter learns in school. I’m also seizing every opportunity I can to breathe, relax, meditate. I went for a run in the rain; hadn’t run in 2 years. Before that, I had to locate a pair of pants I could run in. That forced me to re-arrange my closet for the first time in years.

In other words, even these incredibly mild side-effects are profound. This coronavirus is forcing us to push the reset button on a profoundly dysfunctional, unsustainable way of life. Were we going to do anything about it otherwise? Recent history has shown the opposite.

The combination of cleansing rain and lower vehicle traffic has resulted in the cleanest air I’ve ever breathed in LA. The expected reductions in pollution-related morbidity, and the social distancing effects on diseases other than COVID-19 (like the flu) may offset quite a few of COVID-19 deaths. In other words: while some paint this as a slow-moving apocalypse, it is not all bad. The net societal effect might even positive, if we play our cards right.

As the saying goes: “If you can’t get out of it, get into it”. I am getting into it. It’s nice seeing people taking walks in the neighborhood, seeing lights at people’s windows, and get a feel for what life would be like if we prioritized the local over the distant. It’s a good time to rethink what our society could be like.

This may be quite enough for one post. In the following one, I will tackle risk perceptions, virality, and volatility.


Climate models got their fundamentals right

15 04 2019

Everyone loves to hate climate models: climate deniers of course, but also the climate scientists who do not use these models — there are many, from observationalists to theoreticians. Even climate modelers love to put their models through harsh reality checks, and I confess to have indulged in that myself: about how models represent of sea-surface temperature variations in the tropical Pacific on various time scales (here, and here), or their ability to simulate the temperature evolution of the past millennium.   

There is nothing incongruous about that: climate models are the only physically-based tool to forecast the evolution of our planet over the next few centuries, our only crystal ball to peer into the future that awaits us if we do nothing — or too little — to curb greenhouse emissions. If we are going to trust them as our oracles, we had better make sure they get things right. That is especially true of climate variations prior to the instrumental record (around 1850), since they provide an independent test of the validity of the models’ physics and assumptions. 

In a new study in the Proceedings of the National Academy of Sciences, led by Feng Zhu, a third-year graduate student in my lab,  we evaluated how models fared at reproducing the spectrum of climate variability (particularly, its continuum)  over scales of 1 year to 20,000 years. To our surprise, we found that models of a range of complexity fared remarkably well for the global-mean temperature — much better than I had anticipated. This is tantalizing evidence that models contain the correct physics to represent this aspect of climate, with a big caveat: they can only do so if given the proper information (“initial and boundary conditions”). While the importance of boundary conditions has long been recognized, our study shakes up old paradigms in suggesting that the long memory of the ocean means that initial conditions are at least as important on these scales:  you can’t feed your model a wrong starting point and assume that fast dynamics make it forget all about it within a few years or decades. The inertia of the deep ocean means that you need to worry about this for hundreds — if not thousands — of years. This is mostly good news for our ability to predict the future (climate is predictable), but means that we need to do a lot more work to estimate the state of the deep ocean in a way that won’t screw up predictions. 

Why spectra?

Let us rewind a bit. The study originated 2 years ago in discussions with Nick McKay, Toby Ault, and Sylvia Dee, with the idea of doing a Model Intercomparison Project (a “MIP”, to be climate-hip) in the frequency domain. What is the frequency domain, you ask? You may think of it as a way to characterize the voices in the climate symphony. Your ear and your brain, in fact, do this all the time: you are accustomed to categorizing the sounds you hear in terms of pitch (“frequency”, in technical parlance) and have done it all your life without even thinking about it. You may even have interacted with a spectrum before:  if you have ever tweaked the equalizer on your stereo or iTunes, you understand that there is a different energy (loudness) associated with different frequencies (bass, medium, treble), and it sometimes need to be adjusted. The representation of this loudness as a function of frequency is a spectrum. Mathematically, it is a transformation of the waveform that measures how loud each frequency is, irrespective of when the sound happened (what scientists and engineers would call the phase). 

time_frequency_domains

Fig 1: Time and Frequency domain. Credit: zone.ni.com


If you’re a more visual type, “spectrum” may evoke a rainbow to you, wherein natural light is decomposed into its elemental colors (the wavelengths of light waves). Wavelengths and frequency are inversely related (by, it turns out, the speed of light). 

prism

Fig 2: A prism decomposing “white” light into its constituent colors, aka wavelengths. Credit: DKfindout

So, whether you think of it in terms of sound, sight, or any other signal, a spectrum is a mathematical decomposition of the periodic components of a  signal, and says how intense each harmonic/color is.

Are you still with us? Great, let’s move on to the continuum. 

Why the continuum?

A spectrum is made of various features, which all have their uses. First, the peaks, which are associated with pure harmonics, or tones. The sounds we hear are made of pure voices, with a very identifiable pitch; likewise, the colors we see are a blend of elemental colors.  In the climate realm, these tones and colors  would correspond to very regular oscillations, like the annual cycle, or orbital cycles. All of these show up as sharp peaks in a spectrum. Then there are voices that span many harmonics, like El Niño, with its irregular, 2-7yr recurrence time, showing up as a broad-band peak in a spectrum. Finally, there is all the rest: what we call the background, or the continuum. You can think of the continuum as joining the peaks together, and in many cases it is at least as important as the peaks.

Why do we care about the continuum? Well, many processes are not periodic. To give but one example, turbulence theories make prediction about the energy spectrum of velocity fluctuations in a fluid, characterized by “scaling” or “power law”  behavior of the continuum.  There are no peaks there, but the slope of the spectrum (the “spectral exponent”) is all the rage: its value is indicative of the types of energy cascades that are at play. Therefore, these slopes are very informative of the underlying dynamics.   Hence the interest, developed by many previous studies, in whether models can reproduce the observed continuum of climate variability: if they can, it means they correctly capture energy transfers between scales, and that is what scientists call a “big fucking deal” (BFD). 

Our contribution

fig-01

Fig 3: A spectral estimate of the global-average surface temperature variability using instrumental and paleoclimate datasets, as well as proxy-based reconstructions of surface temperature variability. See the paper for details.

One challenge in this is that we do not precisely know how climate varied in the past — we can only estimate it from the geologic record. Specifically, the data we rely on came from proxies, which are sparse, biased and noisy records of past climate variability. I was expecting to find all kinds of discrepancies between various proxies, and was surprised to find quite a bit of consistency in Fig 1. 

In fact, because we focused on global scales, the signal that emerges is quite clean: there are two distinct scaling regimes, with a kink around 1000 years. This result extends the pioneering findings of Huybers & Curry [2006], which were an inspiration for our study, as were follow-up by Laepple & Huybers [2013a,b, 2014].

It also leads to more questions:

– Why do the regimes have the slopes that they do?

– Why is the transition around 1,000 years?

– Can this be explained by a simple theory, based on fundamental principles?

This we do not know yet. What we did investigate was our motivating question: can climate models, from simple to complex, reproduce this two-regime affair? Why or why not?

What we found is that even simple models (“Earth System Models of Intermediate Complexity”) or a coarse-resolution Global Climate Model (GCM) like the one that generated TraCE-21k capture this feature surprisingly well (Fig 4).

fig-02

Fig 4: The power spectral density (PSD) of transient model simulations. In the upper panel, β is estimated over 2-500 yr. The inset plot compares distributions of the scaling exponents (estimated over 2-500 yr) of GAST in PAGES2k-based LMR vs the PMIP3 simulations. The inset plot compares the β values of the model simulations (red, green, and blue dots) and that of the observations (gray dots). The gray curves are identical as those in Fig. 1. See Zhu et al [2019] for details

The TraCE-21k experiments were designed to simulate the deglaciation (exit from the last Ice Age, 21,000 years ago), and they know nothing about what conventional wisdom says are the main drivers of climate variations over the past few millennia: explosive volcanism, variations in the Sun’s brightness, land-use changes, or, more recently, human activities, particularly greenhouse gas emissions. And yet, over the past millennium, these simple models capture a slope of -1, comparable to what we get from state-of-the-art climate reconstructions. Coincidence?

More advanced models from the PMIP3 project also get this, but for totally different reasons. Most PMIP3 models don’t appear to do anything over the past millennium, unless whacked by violent eruptions or ferocious emissions of greenhouse gases (a.k.a. “civilization”). If you leave these emissions out, in fact, the models show too weak a variability, and too flat a spectral slope.  How could that be, given that they are much more sophisticated models  than the ones used to simulate the deglaciation?

Does the ocean still remember the last Ice Age?

The answer comes down to what information was given to these models: you can have the most perfect model, but it will fail every time if you give it incorrect information. In the PMIP experimental protocol, the past1000 simulations are given a starting point that is in equilibrium with the conditions of 850 AD. That makes sense if you’re trying to isolate the impact of climate forcings (volcanoes, the Sun, humans) and how they perturb this equilibrium. But that implicitly assumes that there is such a thing as equilibrium. Arguably, there never is: the Earth’s orbital configuration is always changing, and if the climate system is always trying to catch up with it. Only a system with goldfish memory of its forcing can be said to be in equilibrium at any given time. So how long is the climate system’s memory? 

What TraCE and the simple EMICs show is that you can explain the slope of the continuum over the past millennium by climate’s slow adjustment to orbital forcing, or abrupt changes that happened over 10,000 years ago. This means that climate’s memory is in fact quite long. Where does it reside?  Three main contenders:

  1. The deep ocean’s thermal and mechanical inertia
  2. The marine carbon cycle
  3. Continental Ice sheets

This is where we reach the limit of the experiments that were available to us: they did not have an interactive carbon cycle or ice sheets, so these effects had to be prescribed. However, even when all that is going on is the ocean and atmosphere adjusting to slowly-changing orbital conditions, we see a hint that the ocean carries that memory through the climate continuum, generating variability at timescales of decades to centuries, much shorter than the forcing itself. Though this current set of experiments cannot assess how that picture would change with interactive ice sheets and carbon cycle, it led to the following hypothesis (ECHOES): today’s climate variations at decadal to centennial scales are echoes of the last Ice Age; this variability arises because the climate system constantly seeks to adjust to ever-changing boundary conditions. 

If true, the ECHOES hypothesis would have a number of implications. The most obvious one is that global temperature is more predictable than has been supposed. The flipside is that this prediction requires giving models a rather accurate starting point. That is, model simulations starting in 1850 AD need to know about the state of the climate system at that time (particularly, the temperature distribution throughout the volume of the ocean), as this state encodes the accumulated memory of past forcings. Accurately estimating this state, even in the present day, is not trivial.

But first things first: is there any support for the ocean having such a long memory? Actually, there is: a recent paper by Gebbie & Huybers makes the point that today’s ocean is still adjusting to the Little Ice Age (around AD 1500-1800). Our results go a step further and suggest that the Little Ice Age, or the medieval warmth that preceded it, also lie on the continuum of climate variability. Though it is clear that they were influenced by short-term forcings, like the abrupt cooling due to large volcanic eruptions, part of these multi-century swings may simply be due to the ocean’s slow adjustment to orbital conditions. Fig 5 illustrates that idea. 

synthesis_figure.001

Fig 5: The impact of initial conditions on model simulations of the climate continuum. Models started with states in equilibrium with 850 AD show too flat a spectral slope unless whacked by the giant hammer of industrial greenhouse gas emissions. On the other hand, models initialized from a glacial state and adjusting to slowly-changing orbital conditions show a much steeper slope, comparable to reconstructions obtained from observations over the past 1000 years. This suggests that the continuum (some parts thereof, at least) is an echo of the deglaciation.


The ECHOES hypothesis is still only that: a hypothesis. It will take more work to test it in models and observations. But, if true, it would imply that even simple climate models correctly represent energy transfers between scales, i.e. that their physics are fundamentally sound. That’s a BFD if there ever was one in climate science. In the future, we would like to test this hypothesis with more complex models (with interactive carbon cycle and ice sheets), which will involve prodigious computational efforts.  If supported by observations, the ECHOES hypothesis will imply that to issue multi-century climate forecasts, one needs to initialize models from an estimate the ocean state prior to the instrumental era. This is a formidable challenge, but — trust us — we have ideas about that too. 


Friendly Advice to Graduate School Applicants

4 01 2018

Happy New Year!

In much of the Northern Hemisphere, this time of the year usually brings winter storms and graduate school applications.  I’ve gotten enough of those over the years that I thought I would compile a list of do’s and don’ts.  I am hoping it will help save your application from a chilly reception, and assist prospective students (PS’s) in their search for the most suitable prospective advisor (PA).

  • Know you audience: First, know that the people reading your application are all the professors from the department to which you are applying. If you are trying to reach a PA in particular, definitely get in touch with them prior to applying. This has 2 major benefits:
    1. you can save yourself some valuable time and money by figuring out if there is mutual interest in your applying at all.
    2. the PA will know who you are, and thus read your application with more interest, if there as been prior communication.
  • Who are you? The second thing to know is that your PA is quite busy, and has limited time to look you up. Thus, it is most helpful when you write to them if you can provide an up-to-date CV, or even better, have a webpage with your CV and examples of your work. Basically: it should not take them any time to figure out who you are, what your skills are, and why you’re applying.
  • Why are you applying? It is essential to show the relevance of your query. If you have a Bachelor’s degree in petroleum engineering, wanting to study climate is not the most obvious career switch. It is large enough an academic jump that you might want to justify it, so as to reassure your PA that you’re not just sending blanket applications to anyone in the geosciences without any notion of what they do, and how you could contribute to their field. In the aforementioned case, you might want to say “After 2 years learning about how to ruin our planet, I’ve decided to save it”, or something along those lines. The case is even more dramatic if you’re switching between the humanities and the sciences, say: the connection will be anything but obvious to anyone but you, so make sure you include an explanation for this (academically) sharp departure. On a more meta level, you should definitely ask yourself why you are applying for grad school. Is it only because you want to buy time before choosing a career? Are you trying to get your feet wet with a masters or  are you already committed to a PhD, and understand what that involves? (spoiler: several years of hard work, followed by more years of harder work). The PA has many roles, but  figuring out your life goals is not one of them.
  • Are you applying to a department or a lab? Some graduate programs are centrally run, admitting the best students they can, then having PA’s compete for the students. In other departments, like mine, you apply to work with one or more PAs, and need to open lines of communication with them, as they ultimately will be making the admission decision. In the rest of this post, I will be treating the second case: applying to a particular lab, not a department as a whole.
  • Show that you understand what your PA does.  Though contact with the PA is essential, my biggest turn-off is to receive an email from a PS asking me what research I do. The first quality of a researcher is doing research, so if you can’t even look up your PA on Google Scholar, you’re not fit for the job. Some PAs have lovely web pages that you can even read!   So do your research on the PA’s research and ask them direct questions about their work. You’ll find them much more willing to engage that way.
  • What is the funding situation? In many places, PhD fellowships are strongly tied to the PA’s research funding. It is a good idea to ask your PA about their current projects, and ask if they have any student funding on some of them. Even better: apply for externally funded PhD fellowships (e.g. from NSF) and come with funding in hand; you won’t find many labs to turn you down!
  • Can you write? Believe it or not, the single most important thing about being a scientist is whether you can communicate your science, and that usually involves writing in English. Therefore, anything that you have written in your own voice (preferably, but not necessarily, about the topic you wish to pursue in grad school) is a valuable datum for your PA. You need not have written a peer-reviewed paper before grad school (few people have!) but you surely have written something by that stage. If you have not (e.g., because you were educated in a language other than English), think of translating some of your academic writing into English to give PAs a chance to see how you think and write.
  • Programming: in my line of work (climate modeling and analysis), some programming knowledge is essential. That does not mean you need to be an expert programmer when you begin (I certainly wasn’t), but some classes help. What does not help are statements of the kind:

I have rich experience in  MATLAB programming and JAVA programming. Not to mention Microsoft Word, Microsoft Excel, Microsoft PowerPoint, and Photoshop software

MATLAB and JAVA are programming languages, but Microsoft Word? Excel?? Powerpoint??? Please! This sort of statement is akin to holding a giant placard over your head, screaming “I don’t have a clue about what programming is, but feel free to give me important tasks!”. It makes me want to “rm -rf”  your application altogether.

  • What kind of lab are you applying to? Is the PA running a boutique operation or a large enterprise? There are benefits to both. In a boutique shop you should get more 1-on-1 interactions, but there’s always a chance that funding might run out. Big labs are usually a sign of sustained funding (yay stability!) but often mean that it’s hard to get any face time with the PA, and you may wind up getting raised by their postdocs, more senior grad students, or – as happens frequently with famous PAs – being left to figure things out by yourself, “sink or swim” style. Figure out your learning style and whether your PA is a good fit for it.
  • Personal style: Ultimately, choosing a PA is not that different from choosing a life partner. It’s a decision that will affect you for the rest of your life, so think about it carefully. It’s not only about their prestige, or that of their institution. It’s also about whether you relate to them on a human level, because you’re about to spend a few years together. You might as well make those enjoyable.
  • Visit the department!  It’s not just about the PA, of course. How is the working environment? The fellow students? The campus? If you can, definitely visit the PA and spend as much time as you can with the students to figure out what life is like at their institutions, and in their research group. If you can track down some of the PA’s former students, they might have valuable insights too – and provide you with an idea of what your trajectory could look like.

Have I forgotten anything? Feel free to let me know below.


The Hockey Stick is Alive; long live the Hockey Stick

11 07 2017

Sometimes science progresses by overturning old dogmas, covering the minds behind luminaries in glory and celebrating individual genius. More often, however, it proceeds quietly, through the work of many scientists slowly accumulating evidence, much like sedimentary strata gradually deposited upon one another over the immensity of geologic time.

The recent PAGES 2k data compilation, which I had the privilege of helping carry across the finish line, falls squarely in the latter category.  To be sure, there is plenty of new science to be done with such an amazingly rich, well-curated, and consistently formatted dataset. Some of it is being done by the 2k collective, and published here. Some of it is carried out in my own research group. Most of it is yet to be imagined. But after slicing and dicing the dataset in quite a few ways, one thing is already quite clear: the Hockey Stick is alive and well.

For those who’ve been sleeping, the Hockey Stick is the famous graph, published in 1999 by Mann, Bradley and Hughes (MBH) and reproduced below. You only need a passing knowledge of climate science to know that it was pretty big news at the time, especially when, in 2001, it was featured in the summary for policy-makers of the Third Assessment Report of the IPCC. The graph was hailed as definitive proof of the human influence on climate by some, and disparaged as a “misguided and illegitimate investigation” by the ever-so-unbiased Joe Barton.

Hockey_stick_chart_ipcc

Because of its IPCC prominence, the graph, the science behind it, and especially its lead author (my colleague Michael E. Mann) became a lightning rod in the climate “debate” (I put the word in quotes to underline the fact that while a lot of the members of the public seem to be awfully divided about it, climate scientists aren’t, and very very few argue about the obvious reality that the Earth is warming, principally as a result of the human burning of fossil fuels).

Since 1998/1999, when the Hockey Stick work started to come out, the field has been very busy doing what science always does when a striking result first comes out: figuring out if is robust, and if so, how to explain it. Mike Mann did a lot of that work himself, but science always works best when a lot of independent eyes stare at the same question. Two things were at issue: the statistical methods, and the data, used by MBH.

Both matter immensely, and I’ve done my fair share of work on reconstruction methods (e.g. here and here). Yet many in the paleoclimate community felt that a lot more could be done to bolster the datasets that go into reconstructions of past temperature, regardless of the methods, and that they had a unique role to play in that. The PAGES 2k Network was thus initiated in 2006, with the goal of compiling and analyzing a global array of regional climate reconstructions for the last 2000 years. Their first major publication came in 2013, and was recounted here. Its most famous outcome was seen as a vindication of the Hockey Stick, to the point that the wikipedia page on the topic now shows the  original “Hockey Stick graph” from MBH99 together with the PAGES2k global “composite” (it cannot be called a reconstruction, because it was not formally calibrated to temperature).

Like many others, I had my issues with the methods, but that was not the point: compared to MBH and subsequent efforts, the main value of this data collection was that it was crowdsourced. Many experts covering all major land areas had collaborated to gather and certify a dataset of temperature-sensitive paleoclimate proxies.

The collective, however, felt that many things could be improved: the regional groups had worked under slightly different assumptions, and produced reconstructions that differed wildly in methodology and quality. The coverage over the ocean was practically non-existent, which is a bit of a problem given that they cover about two thirds of the planet (and growing, thanks to sea-level rise).  Finally, the data from the regional groups were archived in disparate formats, owing to the complete (and vexing) lack of data standard in the field.  So the group kept moving forward to address these problems.  Late in 2014 I got an email from Darrell Kaufman, who asked if I would help synthesizing the latest data collection to produce a successor to the 2013 PAGES 2k curve.  Not having any idea what I was getting myself into (or rather, what my co-blogger and dear friend Kevin Anchukaitis had gotten me into), I accepted with the foolish enthusiasm that only ignorance and youth can afford.

I knew it would work out in the end because the data wrangler in chief was Nick McKay, who can do no wrong. What I sorely under-estimated was how long it would take us to the point where we could publish such a dataset, and even more so, how long until a proper set of temperature reconstructions based on this dataset would be published. Much could be said about the cat-herding, the certifications, the revisions, the quality-control, and the references (oh, the references! Just close your eyes and imagine 317 “paper” reference and 477 data citations. Biblatex and the doi.org API saved out lives, but the process still sucked many months out of Nick’s, Darrel’s, and my time – a bit reminiscent of the machine in Princess Bride). Many thanks need to be given to many people, not least to then-graduate student Jianghao Wang, who developed an insane amount of code on short notice.

But that would take away from the main point: I promised you hockey sticks, and hockey sticks you shall get.  Back in 2007 Steve McIntyre (of ClimateAudit fame) told me “all this principal component business is misguided; the only way you really get the central limit theorem to work out in your favor is to average all the proxies together. This is variously known as “compositing” or “stacking”, but after raising a toddler I prefer the term “smushing” (those of you who have ever given a soft fruit to a toddler will know just what I mean).

Now, it may not be apparent, but I don’t think much of smushing.  On the other hand, the goal of this new PAGES 2k activity was to publish the dataset itself in a data journal, which entailed keeping all interpretations out of the “data descriptor” (the sexy name for such a paper). Many PAGES 2k collaborators wanted to publish proper reconstructions using this dataset, and this descriptor could not go into comparing the relative merits of several  statistical methods (a paper led by Raphi Neukom, which we hope to wrap up soon, is set to do just that). Yet a key value proposition of the data descriptor was to synthesize the 692 records we had from 648 locales, seeing if any large-scale signal emerged out of the inevitable noise of climate proxies. So I overcame my reticence and I went on a veritable smushing fest, on par with what a horde of preschoolers would do to a crate of over-ripe peaches.

The result? Peach purée. Hockey sticks! HOCKEY STICKS GALORE!!!

compositeGlobalBins_web

At first I did not think much of it. Sure, you could treat the data naïvely and get a hockey stick, and what did that prove? Nothing. So I started slicing and dicing the data set in all the ways I could think of.

By archive type? Mostly, that made other hockey sticks (except for marine sediments, which end too early, or have too much bioturbation, to show the blade). By start date? Hockey sticks.

PAGES2k_v2.0.0_qcOnly_reg_raw_compositeByStartDate

Depending on how to screen the data? Nope, still a bunch of hockey sticks.

PAGES2k_v2_0_0_qcOnly_reg_raw_compositeByScreenCrit

By latitude? Mostly, hockey sticks again, except over Antarctica (look forward to a article by the Ant2k regional group explaining why).

PAGES2k_v2_0_0_qcOnly_reg_raw_compositeByLatitude


As a scientist, you have to go where the evidence takes you. You can only be smacked in the face by evidence so many times and not see some kind of pattern.  (you will never guess: a HOCKEY STICK!).

It’s been nearly 20 years since the landmark hockey stick study. Few things about it were perfect, and I’ve had more than a few friendly disagreements with Mike Mann about it and other research questions.  But what this latest PAGES 2k compilation shows, is that you get a hockey stick no matter what you do to the data.

The hockey stick is alive and well. There is now so much data supporting this observation that it will take nothing short of a revolution of how we understand all paleoclimate proxies to overturn this pattern. So let me make this prediction: the hockey stick is here to stay. In the coming years and decades, the scientific community will flesh out many more details about the climate of the past 2,000 years, the interactions between temperature and drought, their regional & local expressions, their physical causes, their impact on human civilizations, and many other fascinating research questions.  But one thing won’t change: the twentieth century will stick out like a sore thumb. The present rate of warming, and very likely the temperature levels, are exceptional in the past 2,000 years, perhaps even longer.

The hockey stick is alive; long live the hockey stick. Climate denialists will have to find another excuse behind which to hide.

J.E.G.

PS: stay tuned for some exciting, smush-free results using this dataset and the framework of the Last Millennium Reanalysis.